This means long positions are trapped on top and the price falls or short positions are trapped on the bottom and the price goes up. Bulls trap is highly reliable and successful because the bulls have already bought and held the positions, which when exited results in a huge price fall due to panic. But, when bears are trapped at the bottom, people fear entering in fresh longs. So, demand is lowe
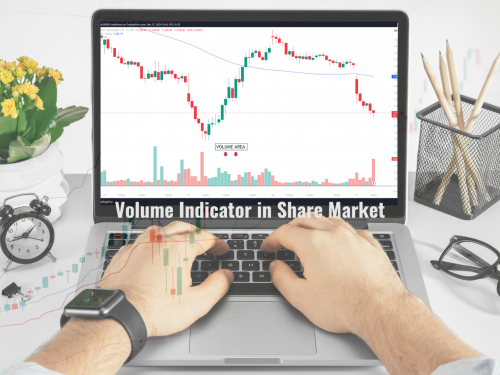
Hey there, fellow market enthusiast! Have you ever wondered about those mysterious bars or lines that show up below stock price charts? Well, those are volume indicators, and they're pretty neat tools that can help you make sense of what's happening in the stock market. Let's dive in and explore what volume indicators are all about!
Technical analysis is like being a detective in the stock market. Instead of looking at a company's financial health or the latest news, technical analysts focus on patterns in stock prices and trading volumes. They believe that history tends to repeat itself in the markets, and by studying past trends, they can make educated guesses about future price movements as per previous market history.
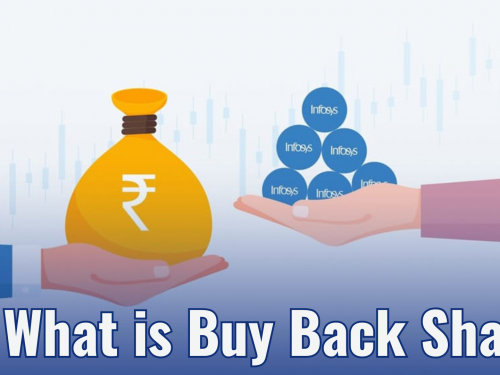
A share buyback, also known as a stock repurchase, is when a company decides to buy its own shares back from the market. The company then cancels the shares, which reduces the total number of shares outstanding. This gives each remaining shareholder a larger stake in the company and a higher return on future dividends.
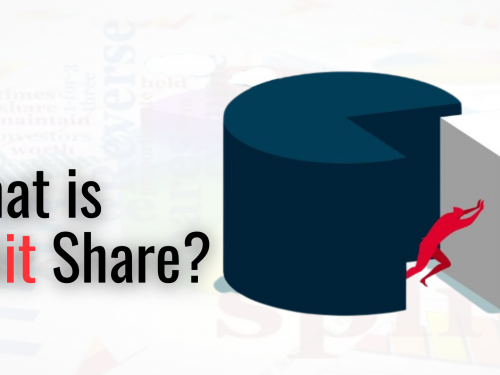
A split share is basically when a company divides its existing shares into multiple shares. The total value of the shares, or the company's market capitalization, remains the same, but the price per share decreases. Imagine you have one big pizza, and you cut it into smaller slices. The pizza itself hasn't changed, but now there are more pieces to go around.
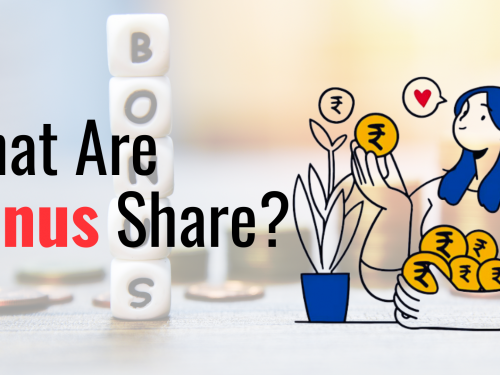
Bonus shares are additional shares that a company gives to its existing shareholders for free. Companies issue bonus shares for several reasons, including Rewarding shareholders, Attracting new investors to invest in particular companies, Increasing liquidity, Demonstrating financial health, and Capitalizing on reserves.
A dividend is like a small profit sharing note from a company to its shareholders. It's a portion of the company's profits that they decide to share with the people who own their stock or company share ownership.
Share face value, also known as par value or nominal value of the share, is the original cost of a share as stated on the share certificate. It's like the "sticker price" of a share when a company first issues it. But here's the thing - this value often doesn't reflect the actual market price of the share.
The share market, also known as the stock market, is like a big marketplace where people buy and sell Shares of companies called shares. It's a place where dreams of financial growth meet the exciting world of business. When you buy shares of the company, you actually own a very small ownership of that company shareholder.
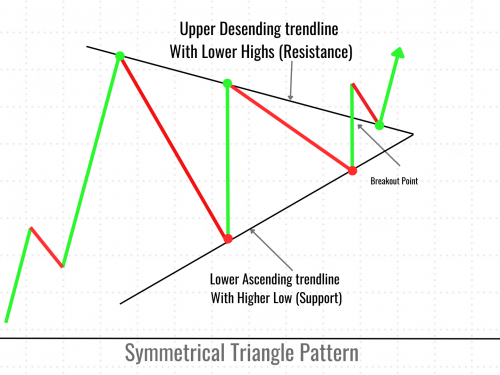
A symmetrical triangle is like a shape on your chart where the price seems to be getting squeezed between two converging trendlines. Here's what it looks like
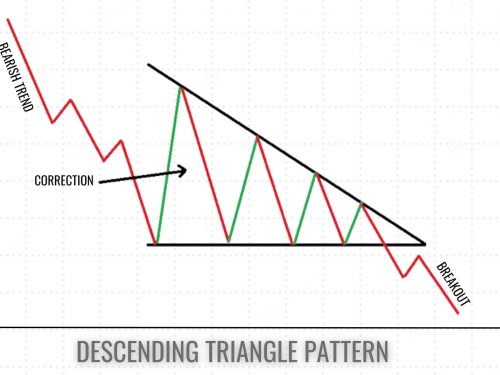
A descending triangle is like a shape that forms on price charts. Imagine drawing a flat line along the bottom where prices keep bouncing off from the support level, and a sloping line on top (resistance level) where prices keep getting lower. That's your descending triangle pattern.
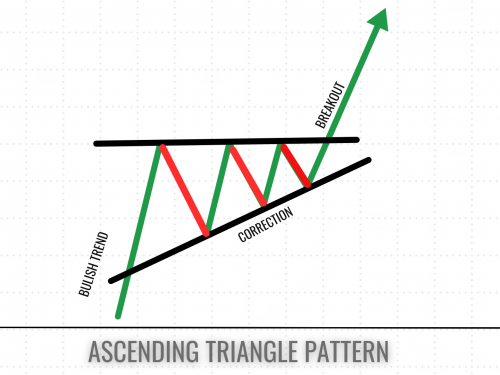
An ascending triangle pattern is like a road sign for traders. It's a chart formation that shows up when the price of an asset is making higher lows, but hitting a consistent resistance level at the top. Picture it like this: the bottom line of the triangle slopes upward, while the top line stays flat. It's as if the price is trying to break through a resistance level.
