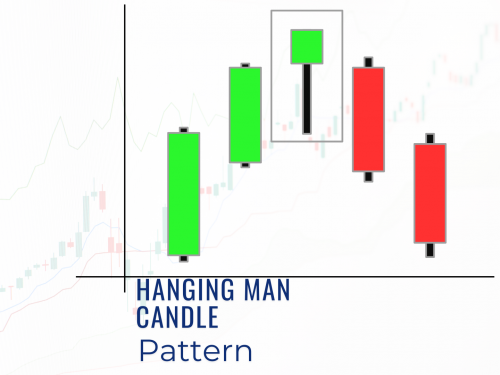
A hanging man candle's opening, closing, and high price are almost the same and look like a hammer candle. The hanging man candle has a small body candle with no upper shadow and the lower side has a lower shadow of at least twice of the the body candle.
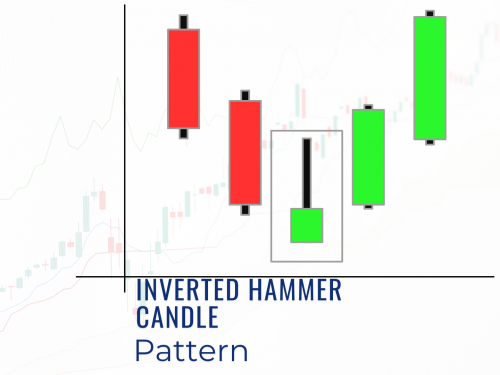
The inverted hammer candle looks like a shooting star and is opposite of the hammer candle. An inverted hammer candle has a long shadow candle upside and doesn’t have lower shadow.
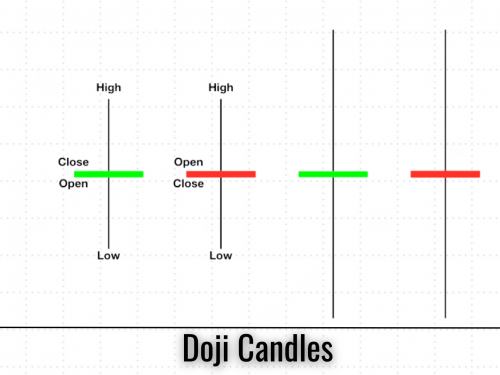
When the candle starts, the buyer wants to buy, the stock and the price move up, seller starts selling on the stocks due to this reason stock unable to move up, and the situation for the seller. When the seller wants to sell and the buyer starts buying and price is unable to move downside. In this way, the stock is trading at the same level and unable to move upside and downside. Finally, a candle
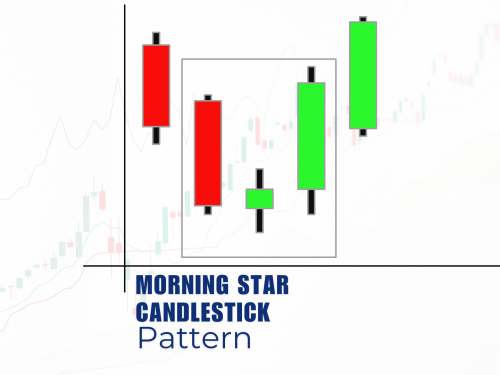
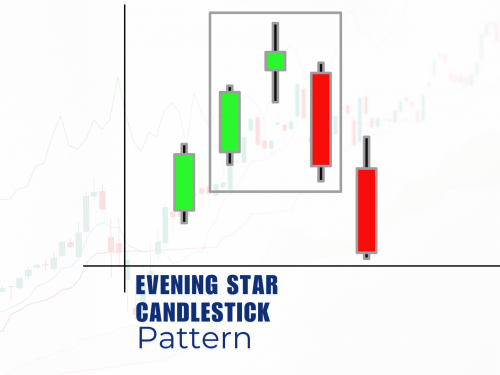
The morning Star candle is a bullish reversal candlestick pattern, which is a combination of 3 candles 1st is a Red candle 2nd is a Doji or star candle red or green, and 3rd candle should be a green candle. When the market is in an uptrend, the evening Star candle is formed at the upper level near the resistance zone or supply zone, and from there signals a bearish reversal.
Picture this: The evening star candlestick pattern is the combination of 3 candles, 1st candle is a green candle and 2nd candle is a doji candle with a small size it may be green or red, and 3rd candle should be a red candle. When the market is in a downtrend, the Morning Star candle is formed at the lower level near the support zone or demand zone, and from there signals a bullish reversal.
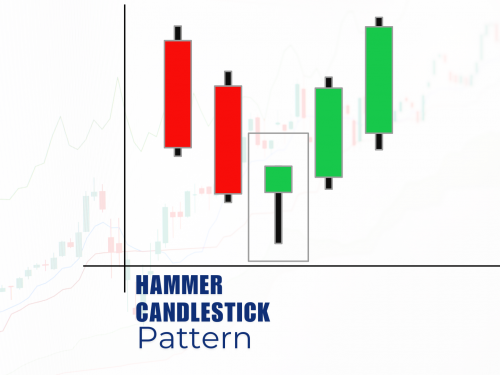
A hammer candle is a bullish reversal candlestick pattern that looks like a hammer, with a small body at the top and a long lower shadow or wick. You'll usually spot these patterns at the bottom of downtrends. When you see this pattern, it means sellers tried to push prices downside during the intraday trading session, but buyers stepped in and pushed prices back upside down.
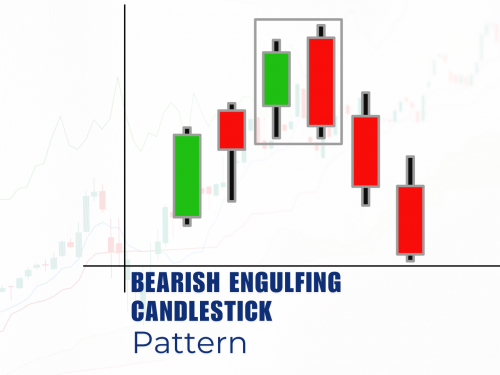
A bearish engulfing candlestick pattern is a bearish reversal candlestick pattern which is a specific formation in candlestick charts that often signals a potential down trend. It consists of two candles (1st candle is Green and the second candle is Red) a smaller bullish green candle followed by a larger bearish red candle that completely covers or "engulfs" the previous body candle.
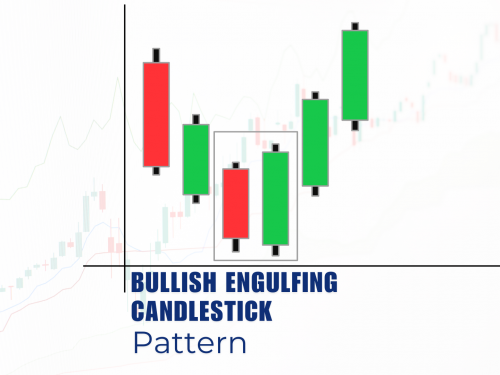
A bullish engulfing candlestick pattern is a bullish reversal candlestick pattern which is the two-candle formation that often signals a strong trend bullish reversal in the market. It happens when a smaller red bearish candle is followed by a larger green bullish candle that completely covers or "engulfs" the previous candle.
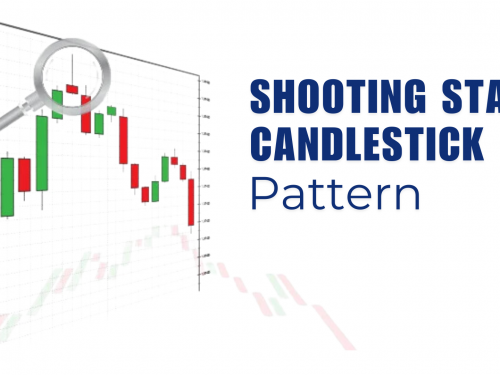
A shooting star candlestick pattern is a bearish reversal candlestick pattern, which is a specific type of candlestick formation that appears on trading charts. It looks like an inverted hammer candle, with a small body candle and a long upper shadow, but no lower shadow.
Have you ever felt lost in the sea of financial charts and graphs? You're not alone. Many investors and traders find themselves puzzled by the complex world of market analysis. But what if there was a simple yet powerful tool that could unlock the secrets of price movements?
