Hammer candlestick pattern
What is a Hammer Candle?
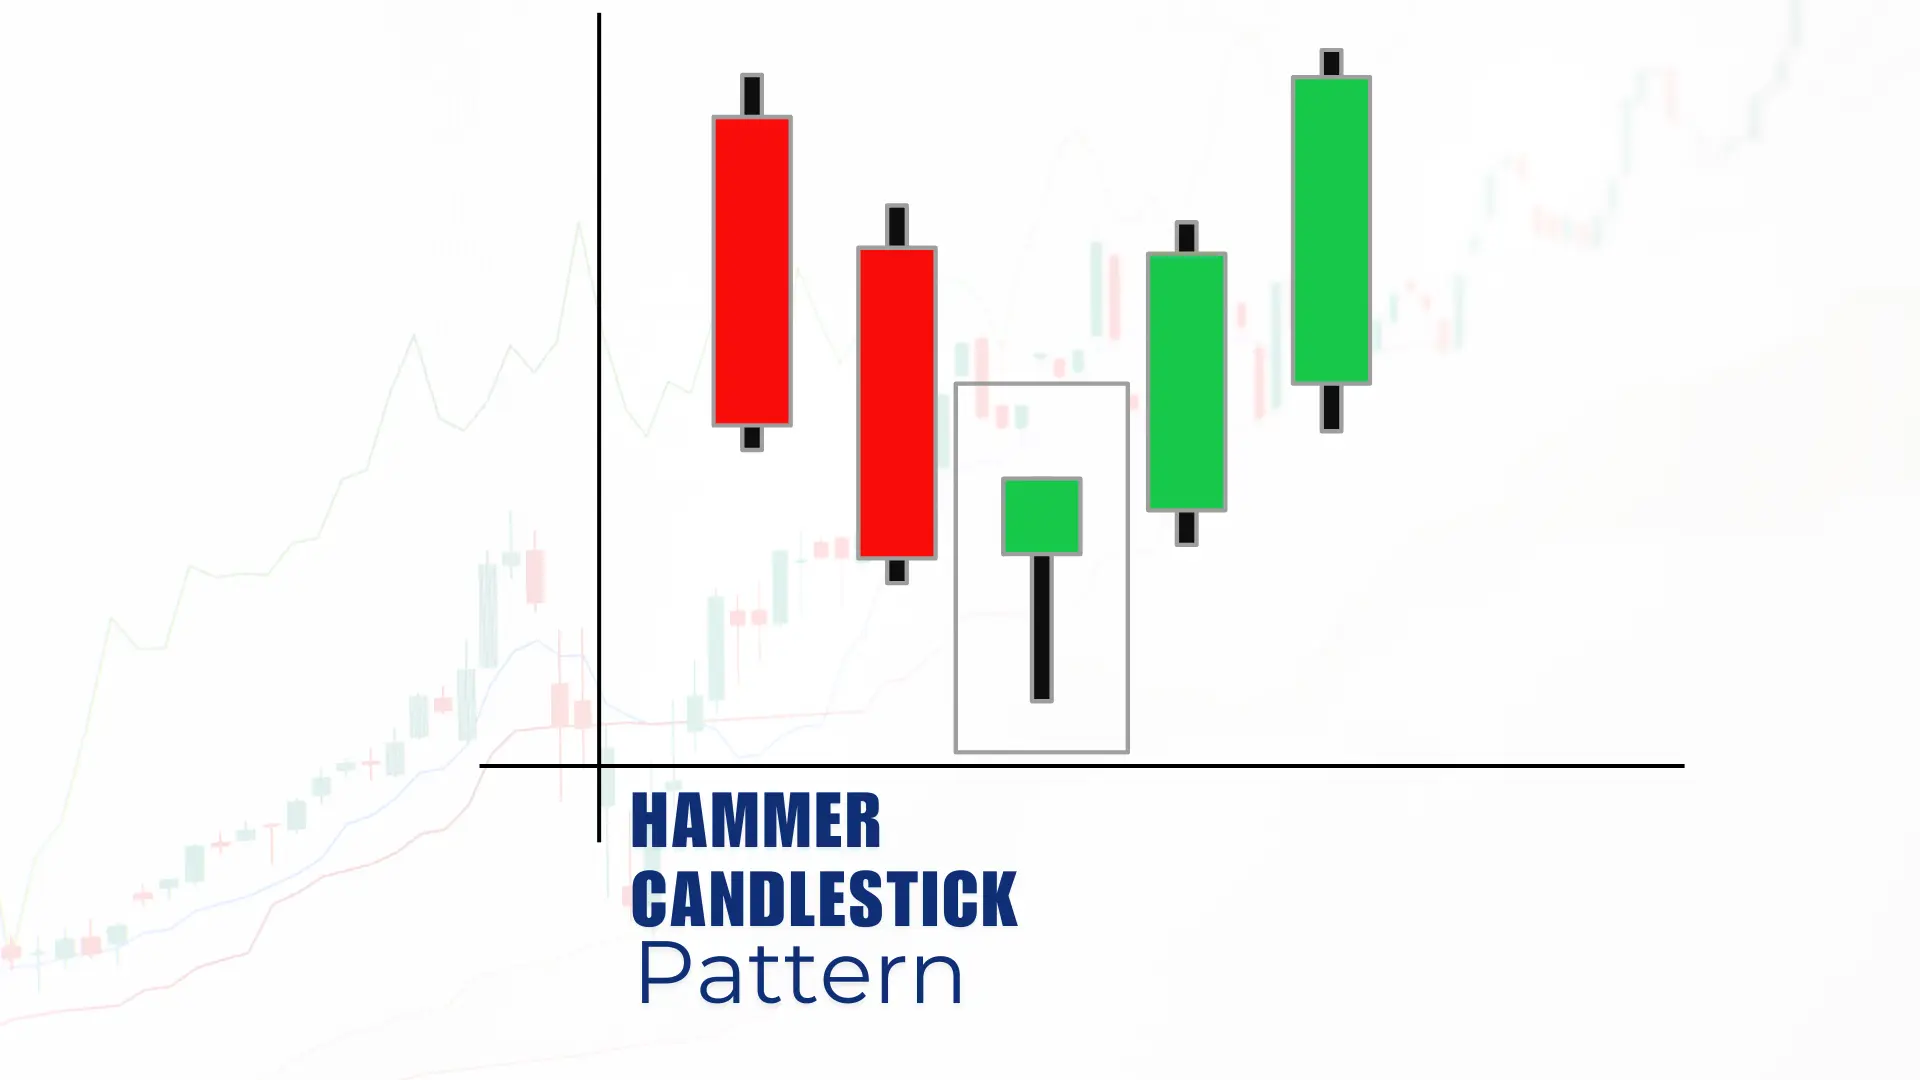
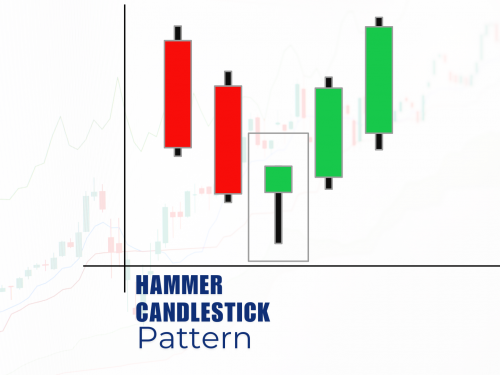
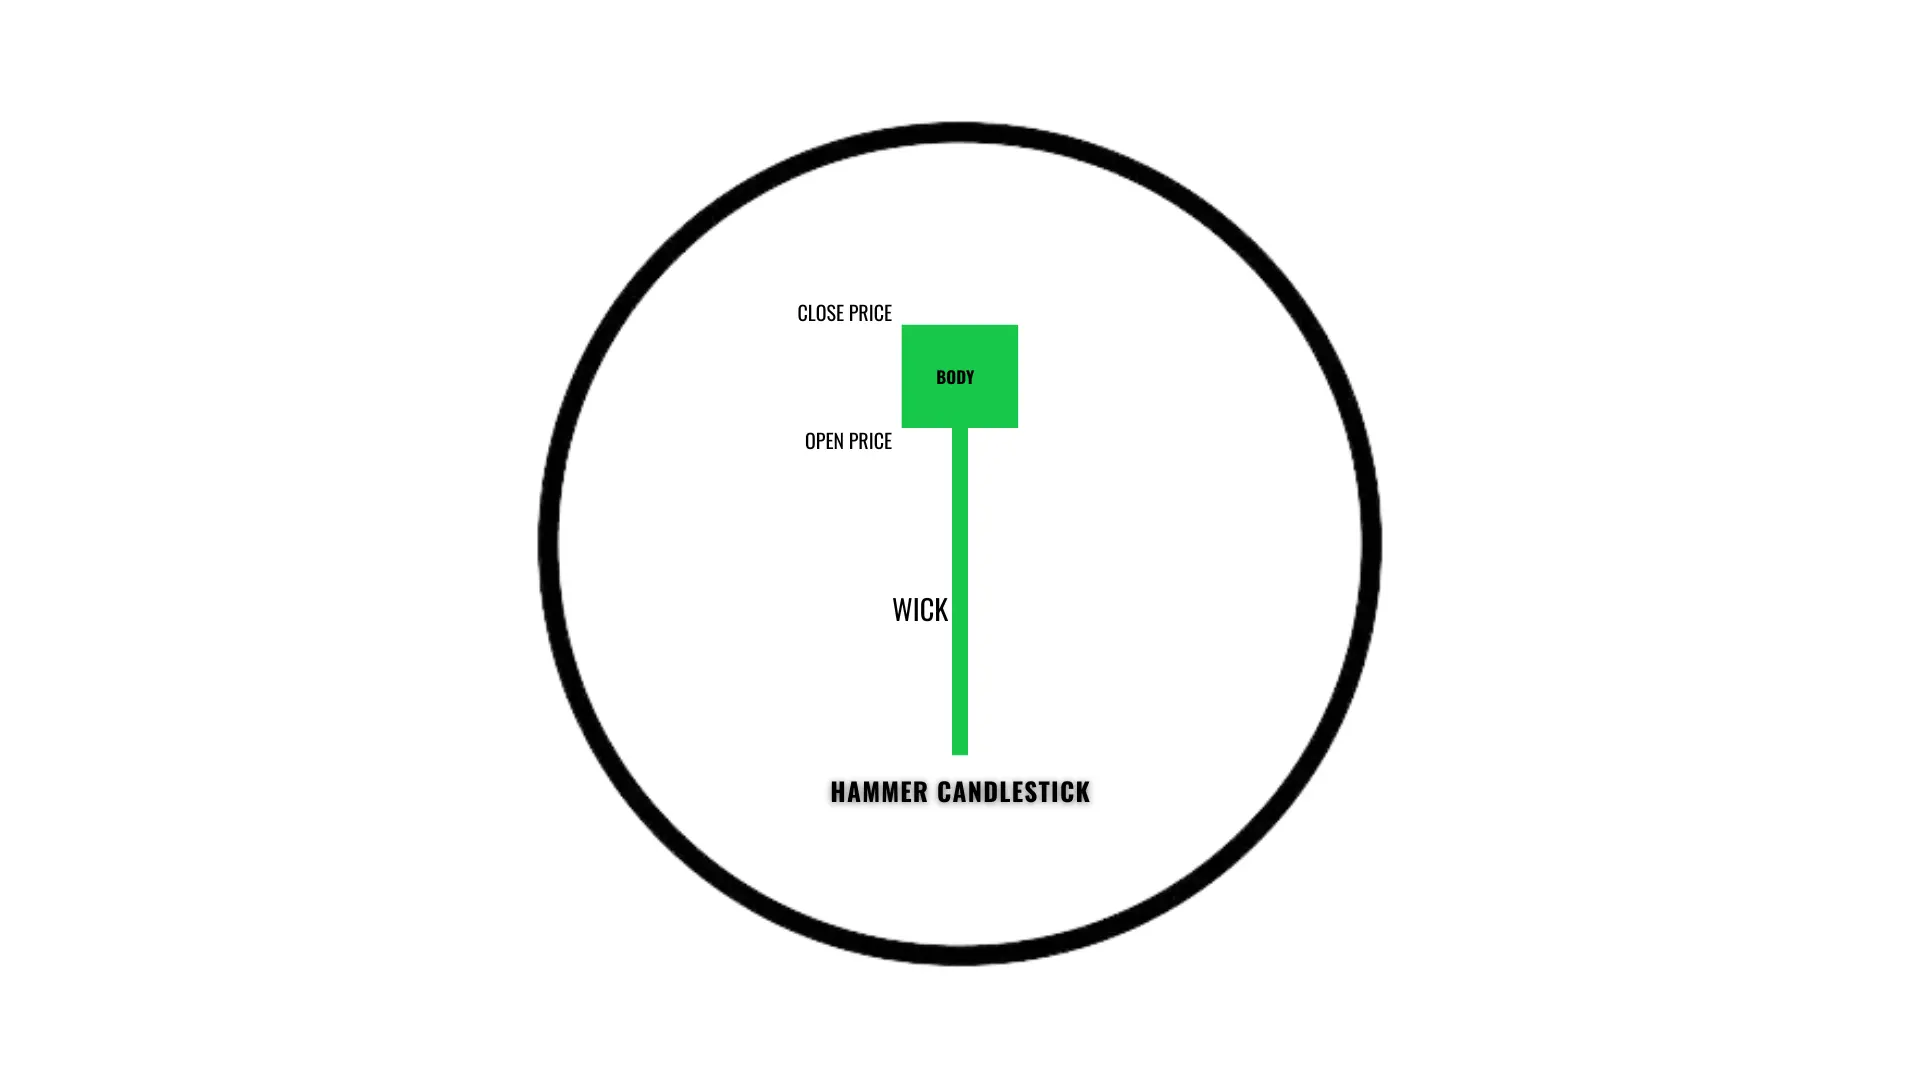
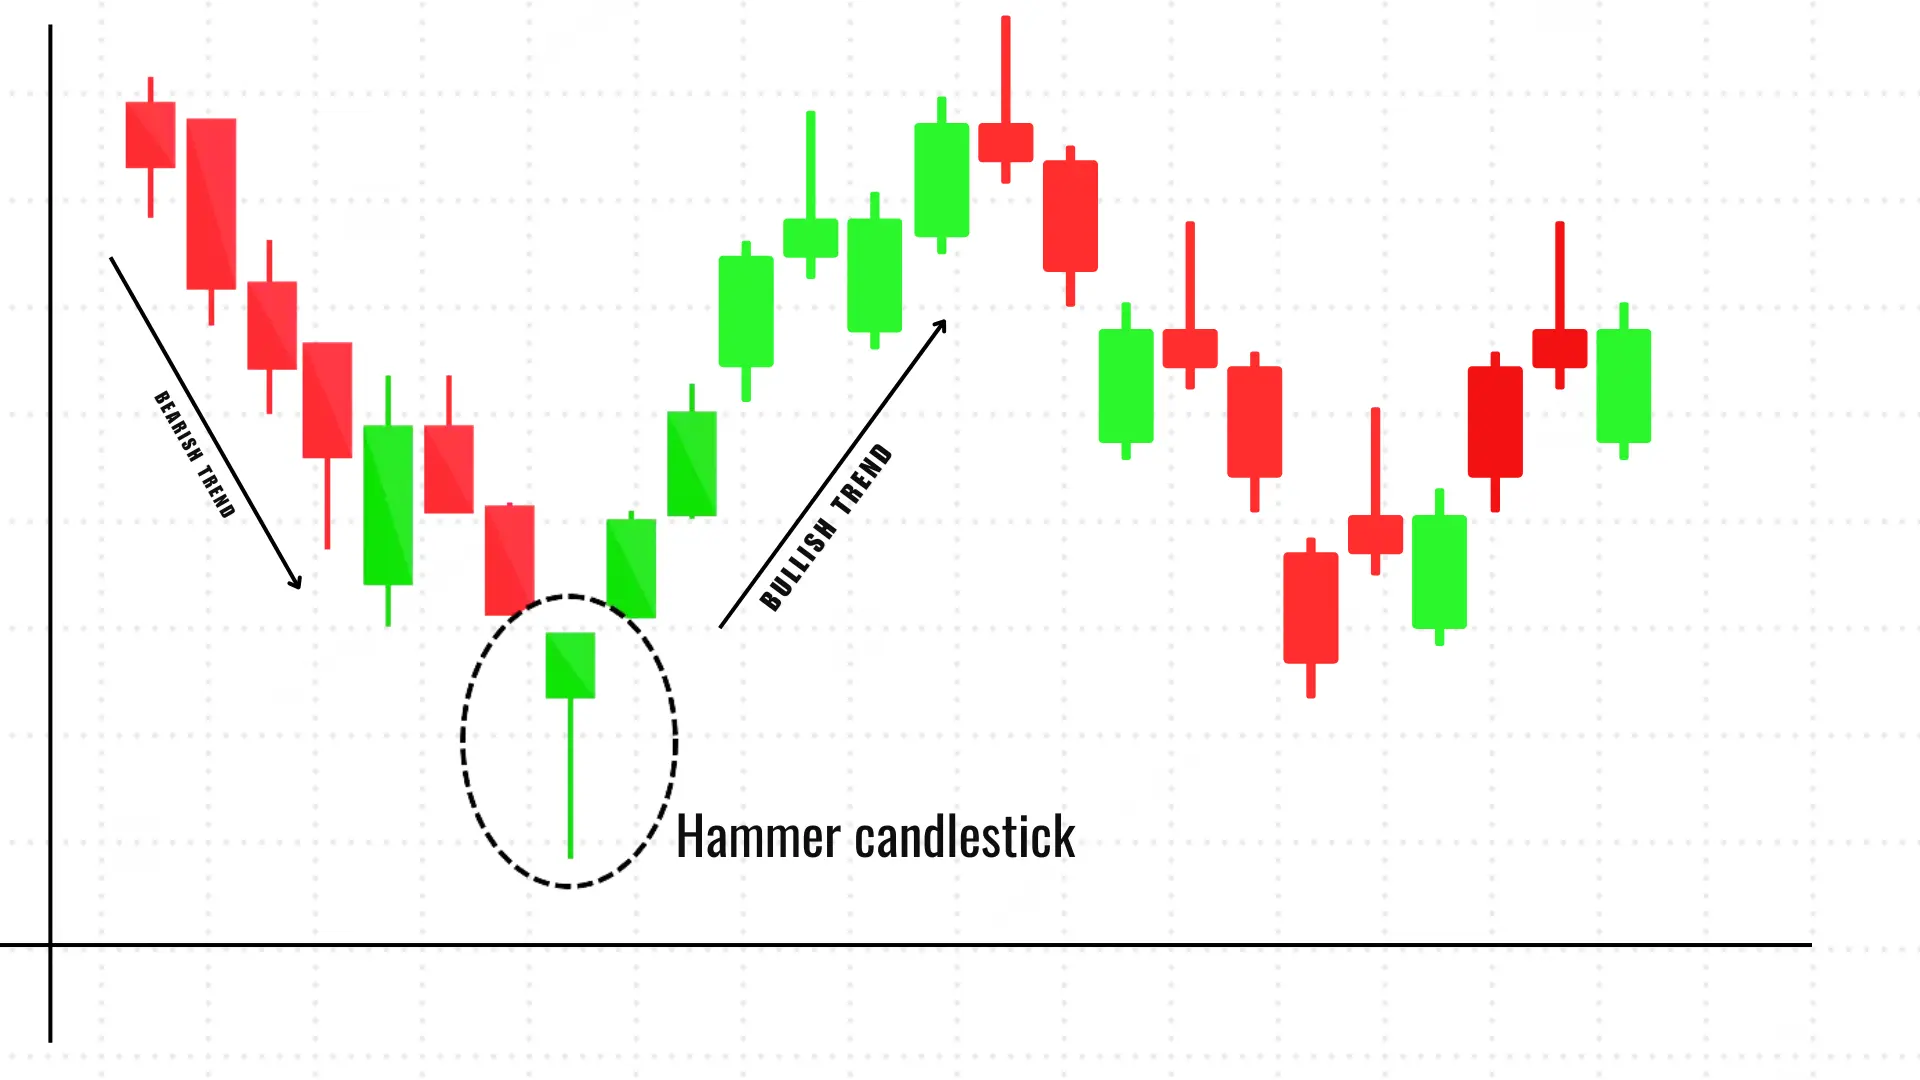
A hammer candle is a bullish reversal candlestick pattern that looks like a hammer, with a small body at the top and a long lower shadow or wick. You'll usually spot these patterns at the bottom of downtrends.
When you see this pattern, it means sellers tried to push prices downside during the intraday trading session, but buyers stepped in and pushed prices back upside down.
Important Features of a Hammer Candle
Small body at the upper end.
Long lower shadow ( 3-4 times of the body candle).
Little to no upper shadow.
Can be either green (bullish) or red (bearish).
How to Identify Hammer Candlestick Pattern?
Characteristics of hammer candle.
Must appear during a downtrend market.
Lower shadow should be at least 3-4 the size of the body.
The upper shadow should be very small or non-existent.
The longer the lower shadow, the more significant the pattern.
We have to Avoid Common Mistakes.
Don't confuse, it with a hanging man (similar candle but different context).
Avoid trading the pattern in a sideways market.
Remember that trend matters - it needs to be in a downtrend market.
How to trade with Hammer Candles?
Entry Point for trade
Wait for the next candle to confirm the upward movement.
Look for supporting evidence like increased volume and RSI.
Consider entering when the price moves above the hammer's candle high.
What should be Stop Loss?
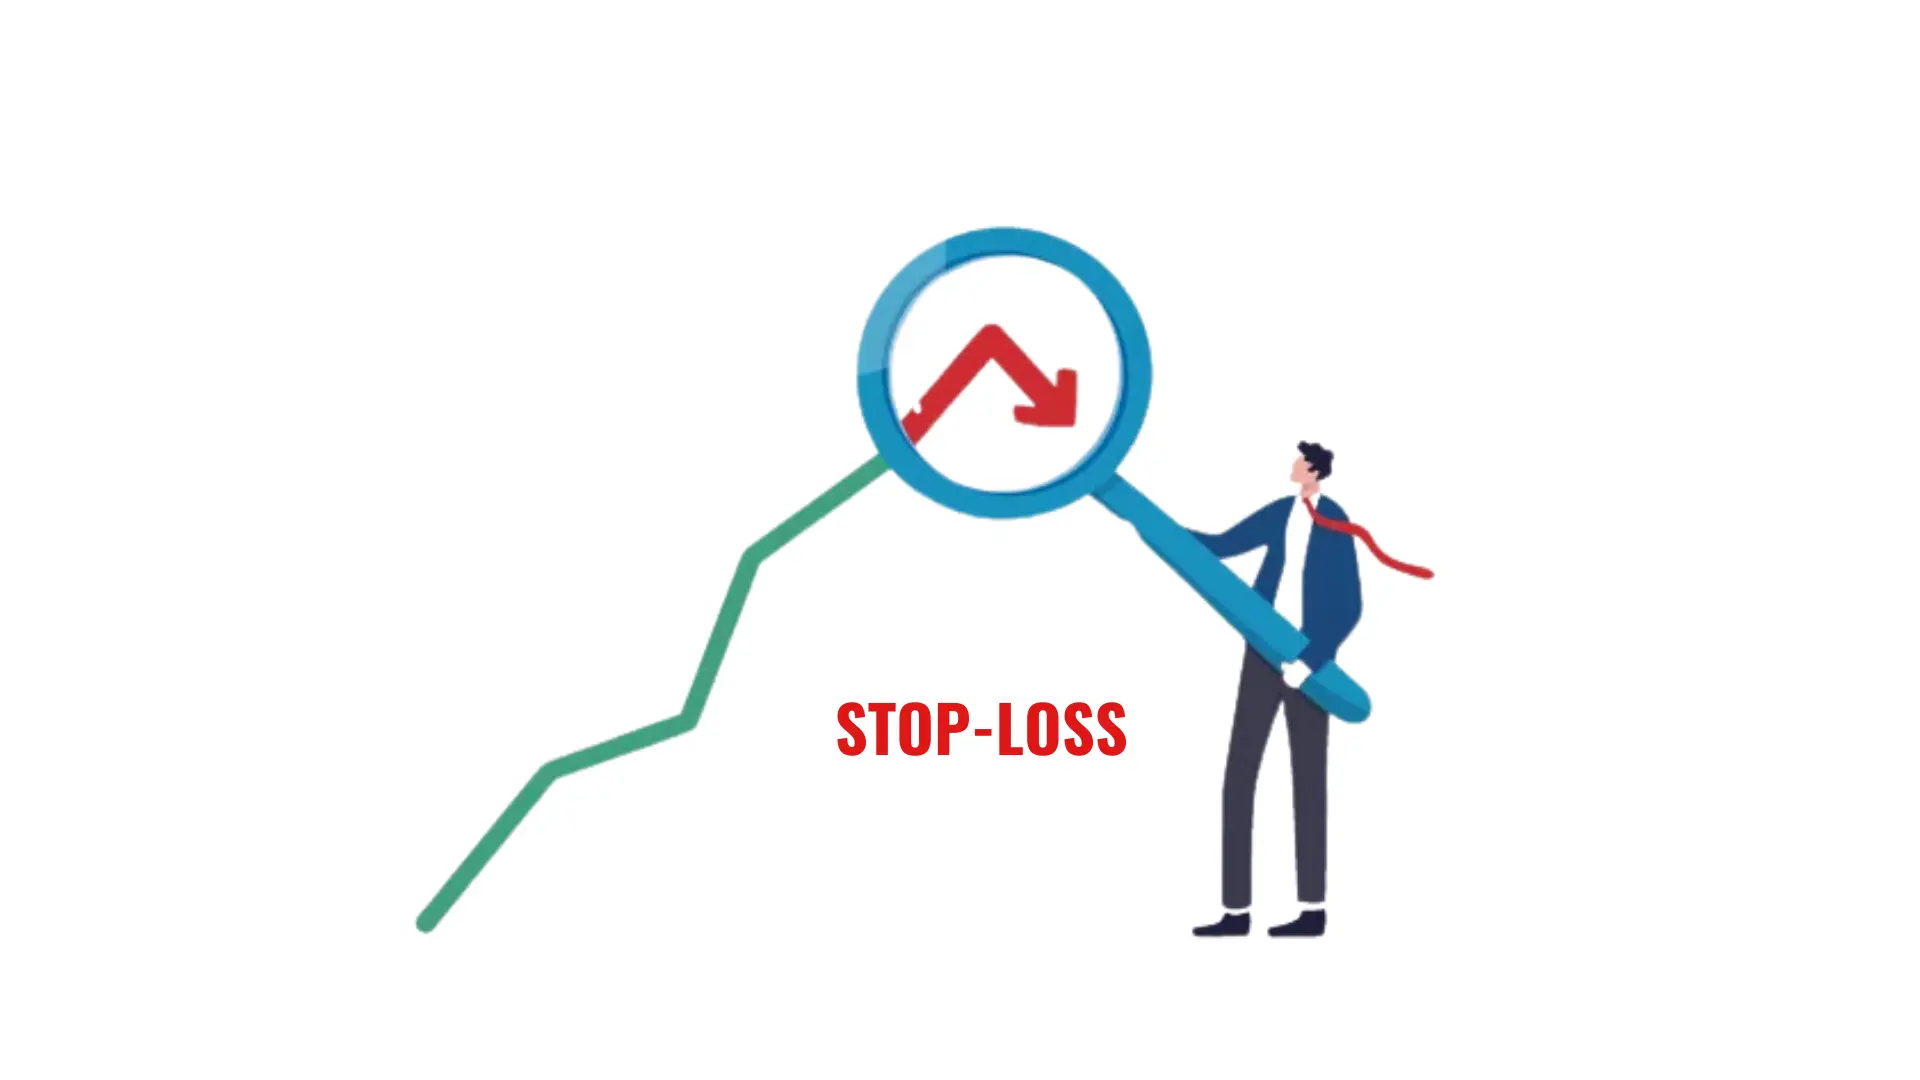
Place stoploss order below the hammer's candle below the point.
Keep your risk manageable (usually 1-2% of your account).
Consider market volatility when placing a stop-loss order.
Remember for better trading with Hammer candle Pattern
Always check the bigger picture of the chart on higher timeframes.
Combine with other technical indicators like volume and RSI.
Look for volume confirmation.
Be patient and wait for clear confirmation of the candle.
A hammer pattern is just one tool in your trading toolbox. It works best when combined with other analysis methods and good risk management.
"Unlock Your Investment Potential – Open a Demat Account with Upstox Referral Link Today!"
