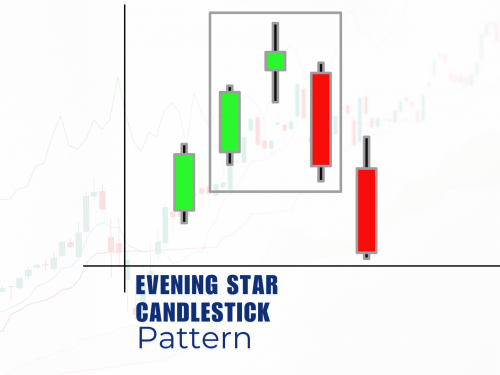
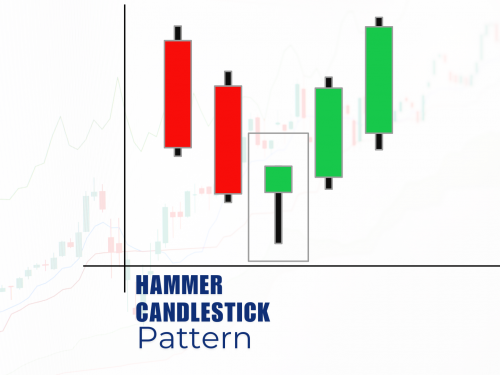
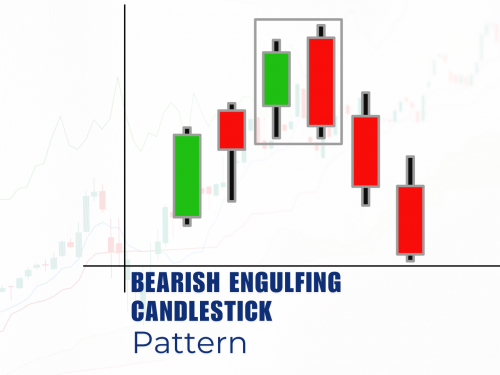
Have you ever felt lost in the sea of financial charts and graphs? You're not alone. Many investors and traders find themselves puzzled by the complex world of market analysis. But what if there was a simple yet powerful tool that could unlock the secrets of price movements?
Enter the candlestick chart – a game-changer in the world of technical analysis. This centuries-old technique, originating from Japan, has revolutionized how we interpret market data. Whether you're a seasoned trader or just starting your investment journey, understanding candlesticks can be your secret weapon for making informed decisions. In this post, we'll demystify candlesticks, exploring what they are and the basic elements that make them such a valuable tool in your financial toolkit.
What is a Candlestick?
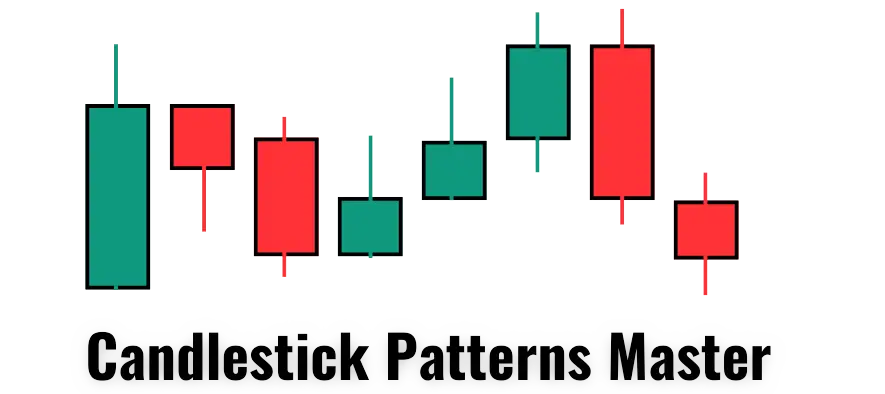
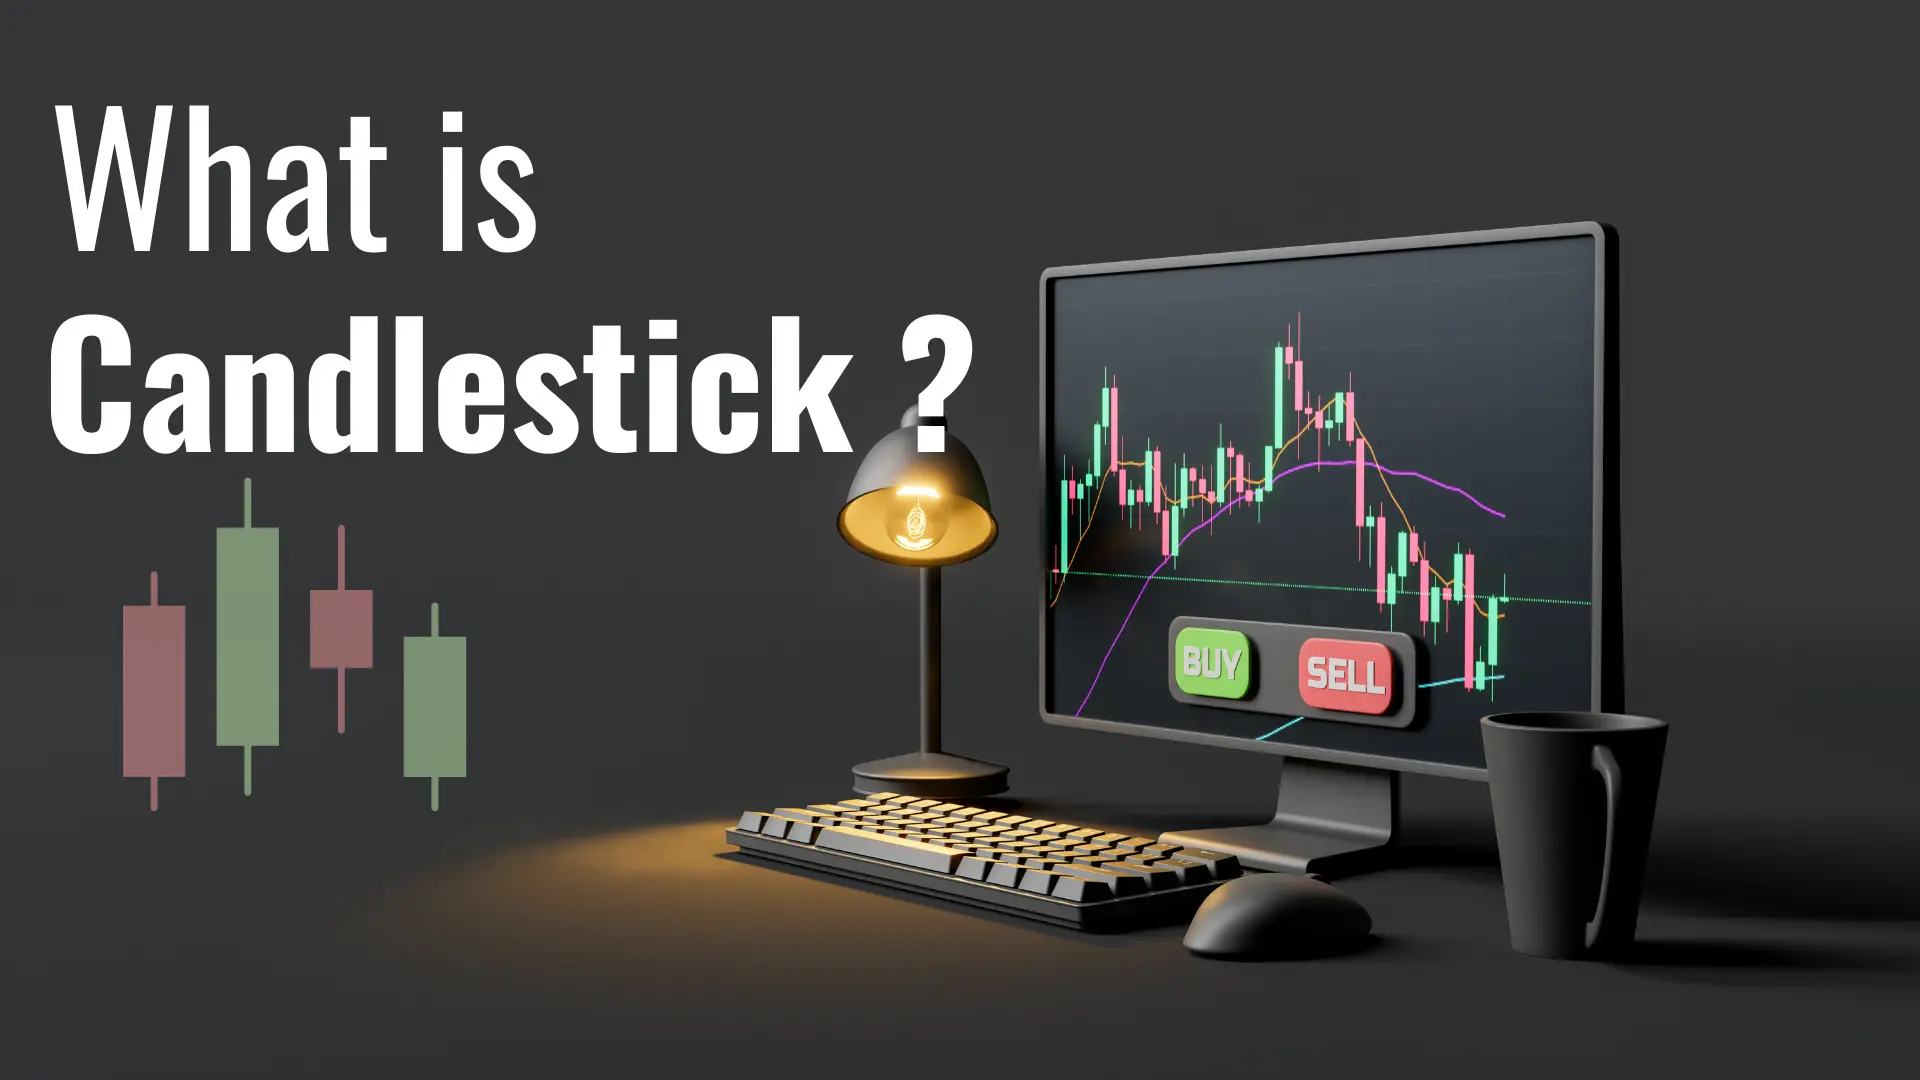
A candlestick is a powerful tool in technical analysis used to represent price movements of financial instruments over specific periods. Originating in Japan in the 18th century, candlesticks have become essential to modern trading and investing strategies.
Key Takeaways

1.Visual representation:
- Candlesticks provide a quick, visual snapshot of price action.
- They show opening, closing, and high, and low prices in a single chart element.
2. Time flexibility:
- Can represent various time frames (e.g., 1-minute, hourly, daily, weekly).
- Allows traders to analyze short-term and long-term trends.
3. Pattern recognition:
- Candlesticks form recognizable patterns that can signal potential market reversals or continuations.
- Examples include doji, hammer, and engulfing patterns.
4. Components of a candlestick:
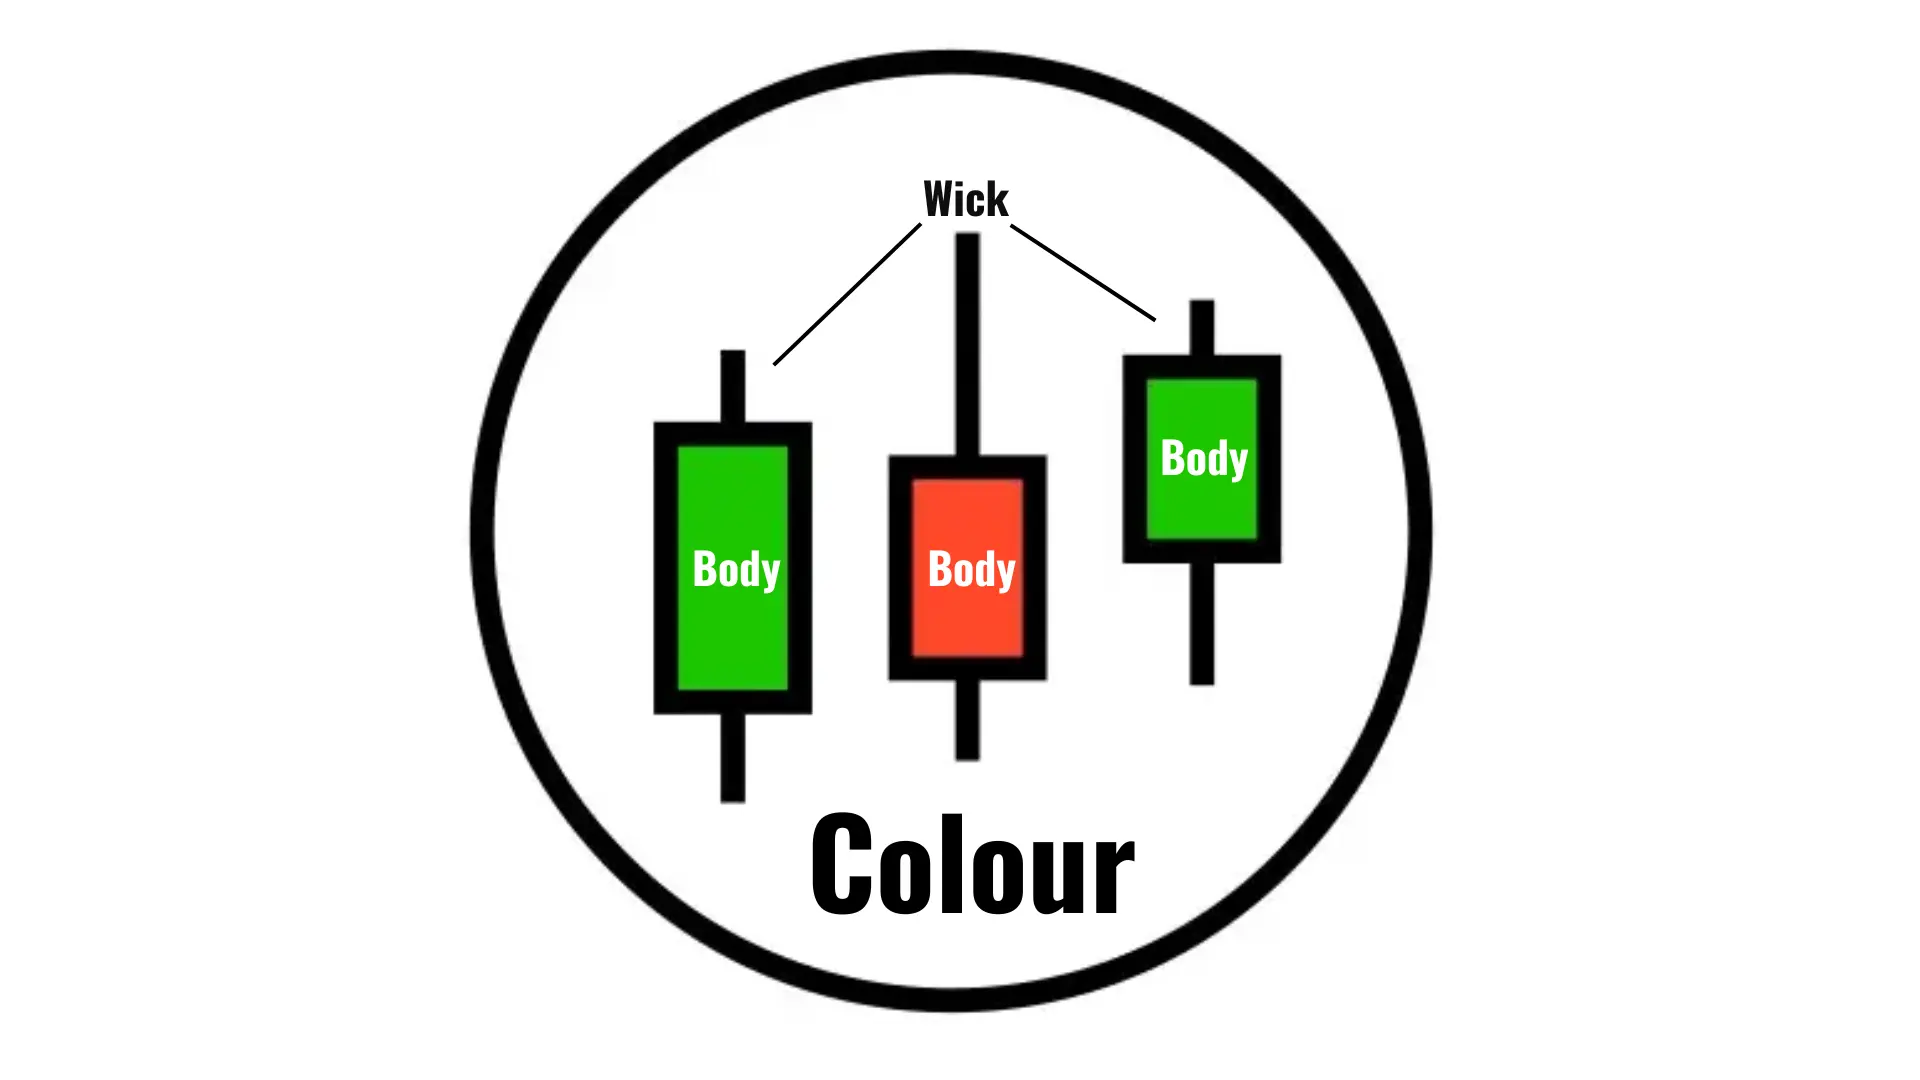
Component | Description |
Body | Represents the difference between opening and closing prices |
Wick | Shows the high and low prices during the period |
Colour | Indicates whether the price closed higher (often green) or lower (often red) than it opened |
5. Versatility:
- They are used across various financial markets (stocks, forex, commodities, cryptocurrencies).
- It can be combined with other technical indicators for comprehensive analysis.
Understanding candlesticks is crucial for traders and investors seeking insights into market sentiment and potential price movements. With this foundation, we can now delve into the specifics of candlestick construction and interpretation.
The Basics of a Candlestick
Now that we understand a candlestick, let's delve into its basic components and common patterns. A candlestick consists of a body and wicks, each representing crucial price information.
White/Green Candlesticks
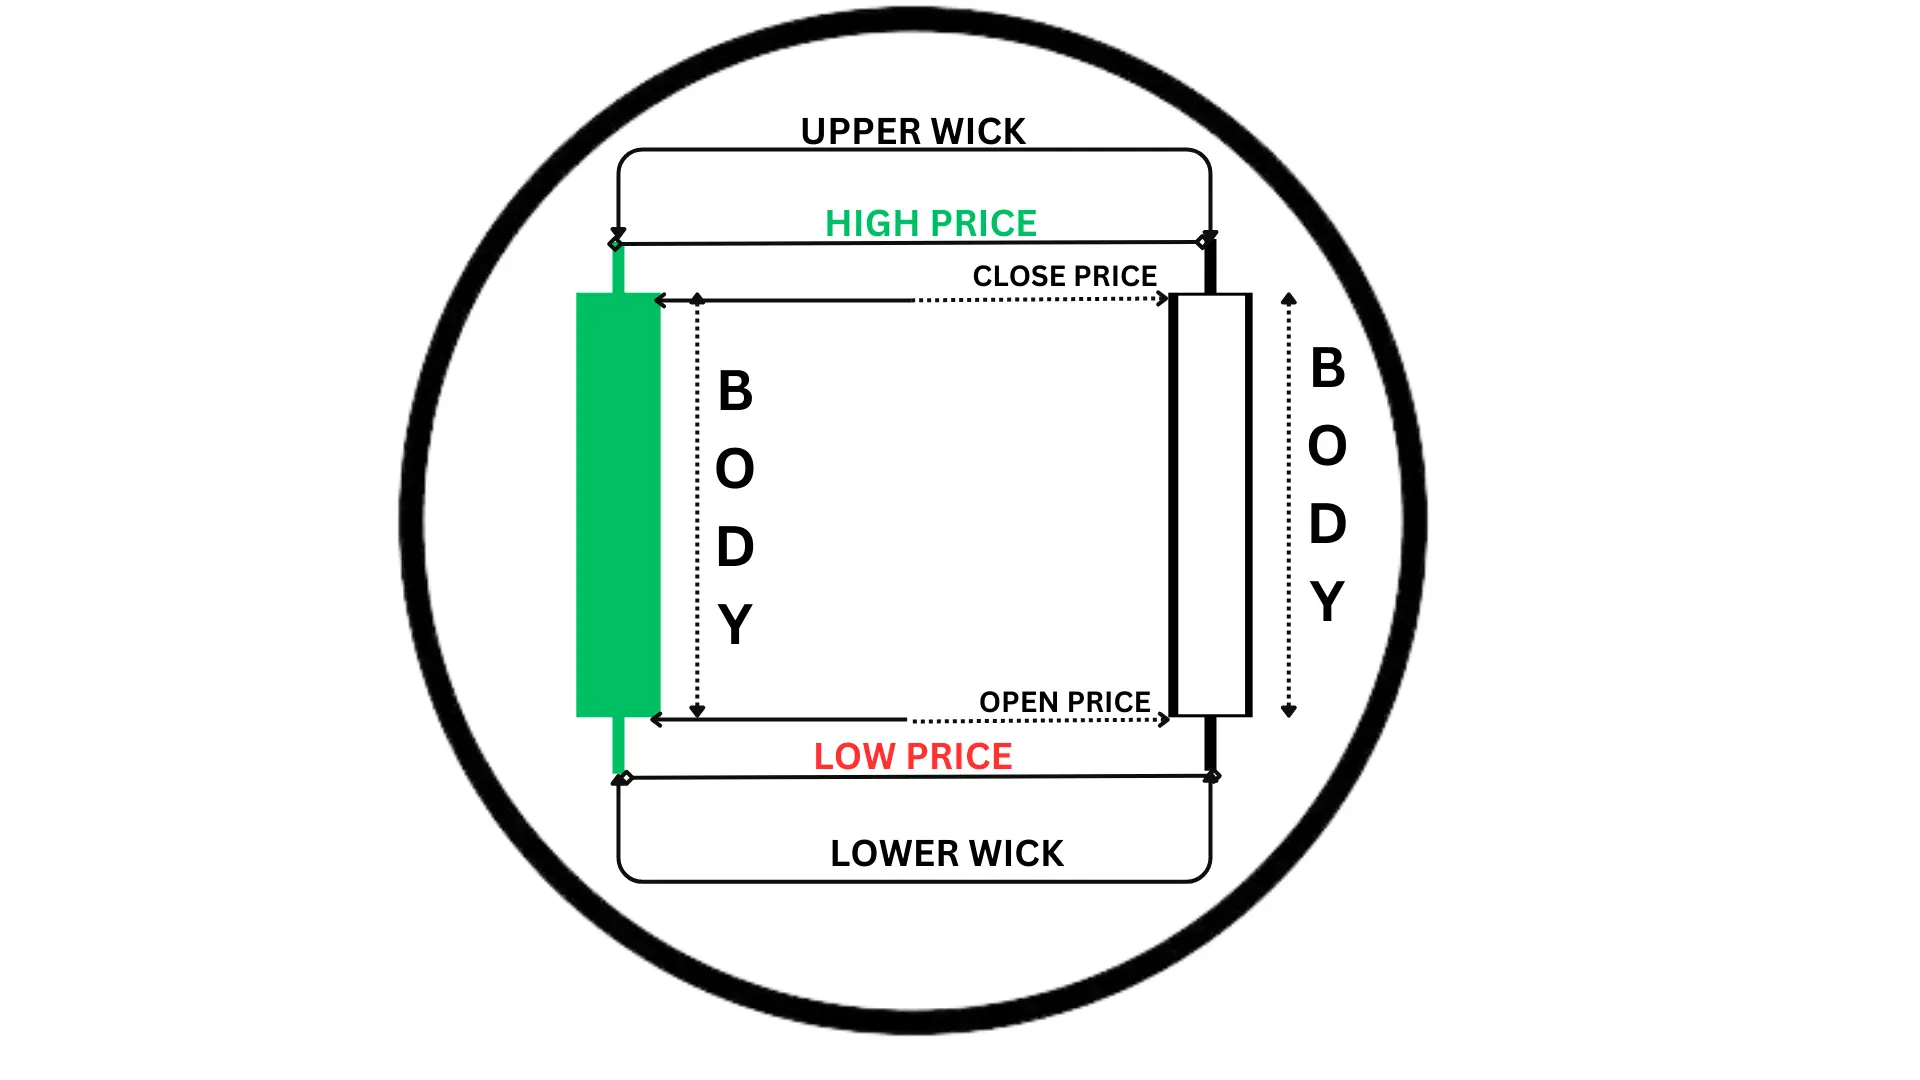
White or green candlesticks indicate bullish sentiment:
- Body: Represents the difference between opening and closing prices
- Upper wick: Shows the highest price during the period
- Lower wick: Indicates the lowest price during the period
Component | Meaning |
Long body | Strong buying pressure |
Short body | Weaker bullish momentum |
Long upper wick | Rejection of higher prices |
Long lower wick | Strong support at lower levels |
Black/Red Candlesticks
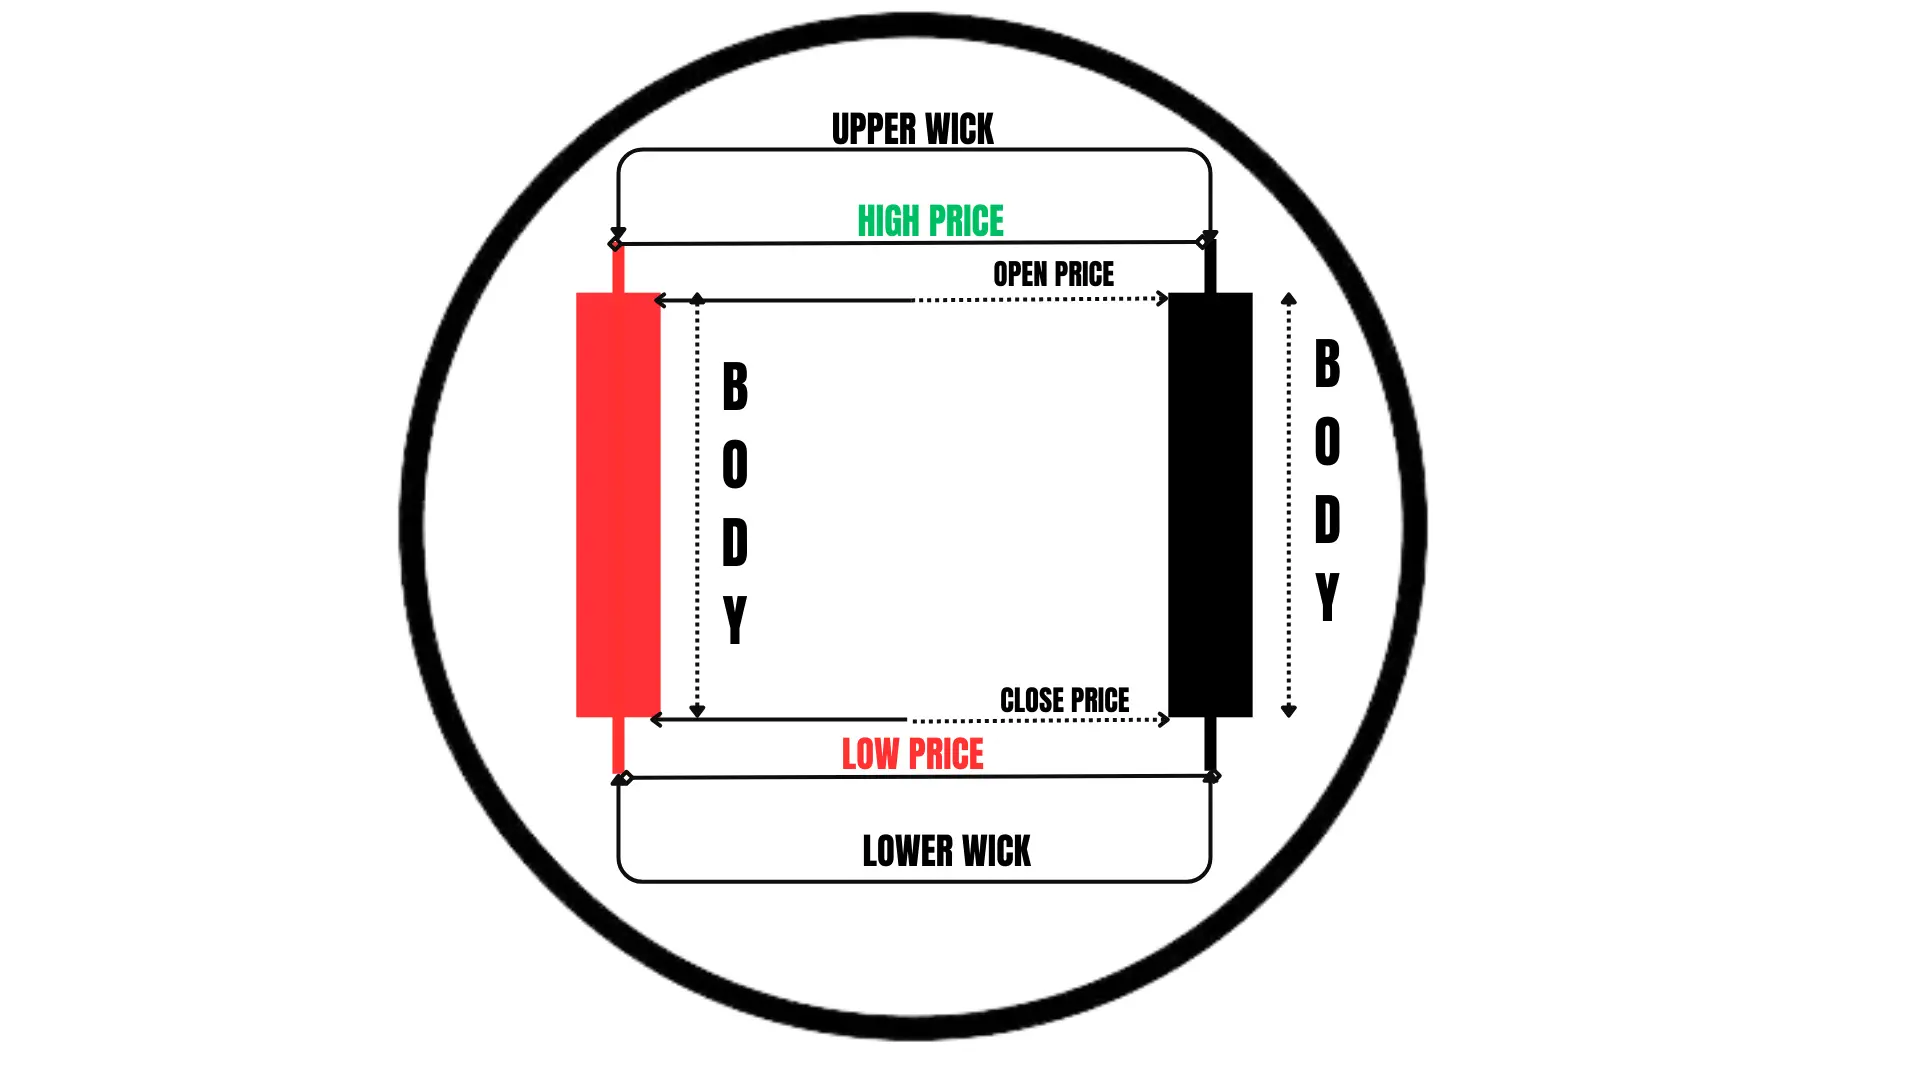
Black or red candlesticks signify bearish sentiment:
- Body: Represents the difference between opening and closing prices
- Upper wick: Shows the highest price during the period
- Lower wick: Indicates the lowest price during the period
“Unlock Your Investment Potential – Open a Demat Account with Upstox Referral Link Today!”
