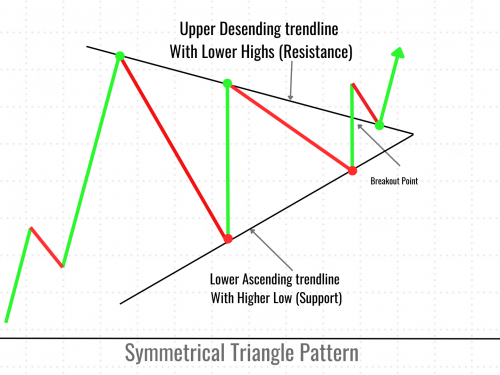
A symmetrical triangle is like a shape on your chart where the price seems to be getting squeezed between two converging trendlines. Here's what it looks like
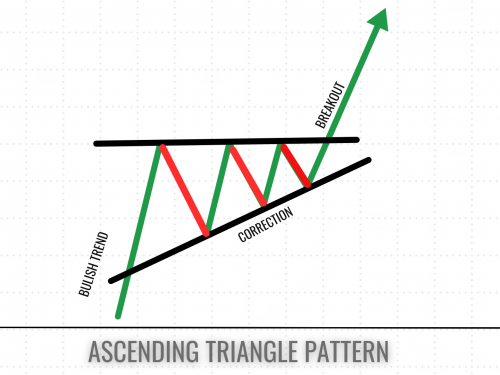
An ascending triangle pattern is like a road sign for traders. It's a chart formation that shows up when the price of an asset is making higher lows, but hitting a consistent resistance level at the top. Picture it like this: the bottom line of the triangle slopes upward, while the top line stays flat. It's as if the price is trying to break through a resistance level.
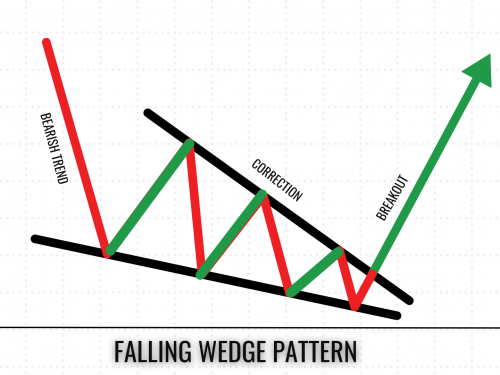
What is a Falling Wedge Pattern and How to Work with It?
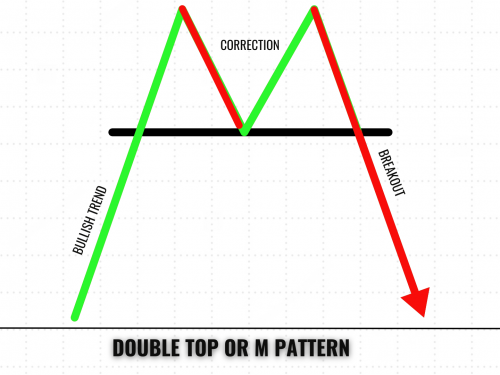
Double top or M pattern, which is a bearish reversal pattern. That looks like the English letter M. The double-top pattern is most commonly used in intraday trading. The accuracy of the M pattern is almost 70-75% for intraday trading. Where the stock or index is unable to move up once the M pattern is formed. Due to this decline is seen.
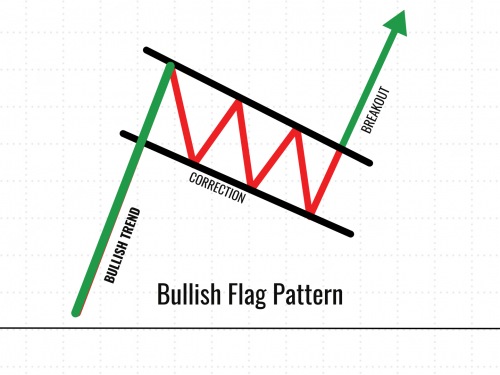
A bullish flag pattern is a pattern formed during a counter-trend move after a sharp price movement. Bullish flag patterns form during an uptrend. Imagine a flagpole (that's the initial price surge) followed by a rectangular shape (that's the flag part). This pattern usually means good things are coming for the price of whatever you're trading.
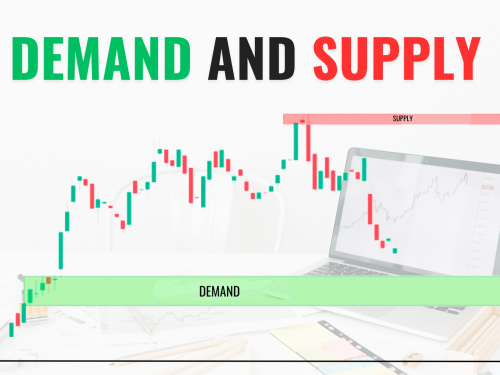
A support zone or demand zone is an area on a price chart where buying interest is strong enough to push prices higher. Supports are formed when a stock breaks above resistance and holds above that level: the old resistance then becomes support. Support levels are also formed when a stock spends a lot of time at one level and then breaks upward.
