What is a Falling Wedge Pattern and How to Work with It?
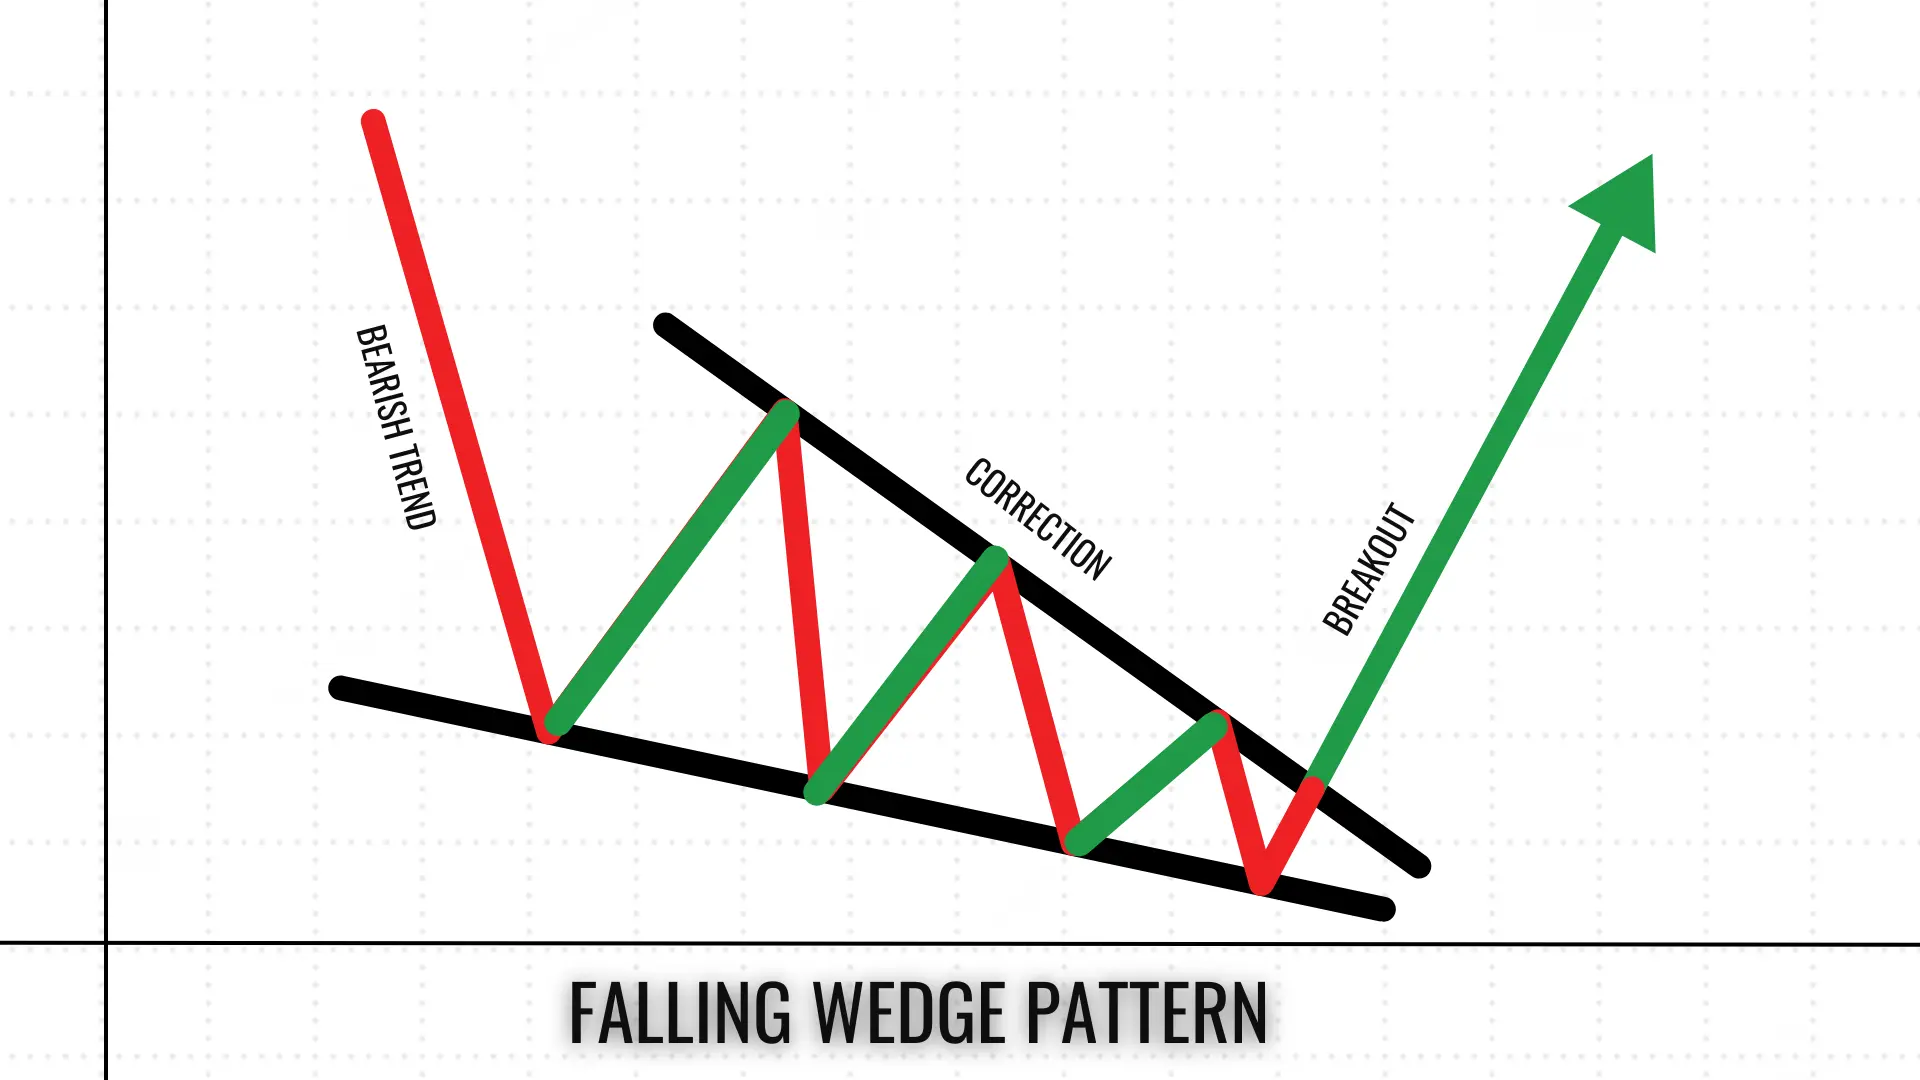
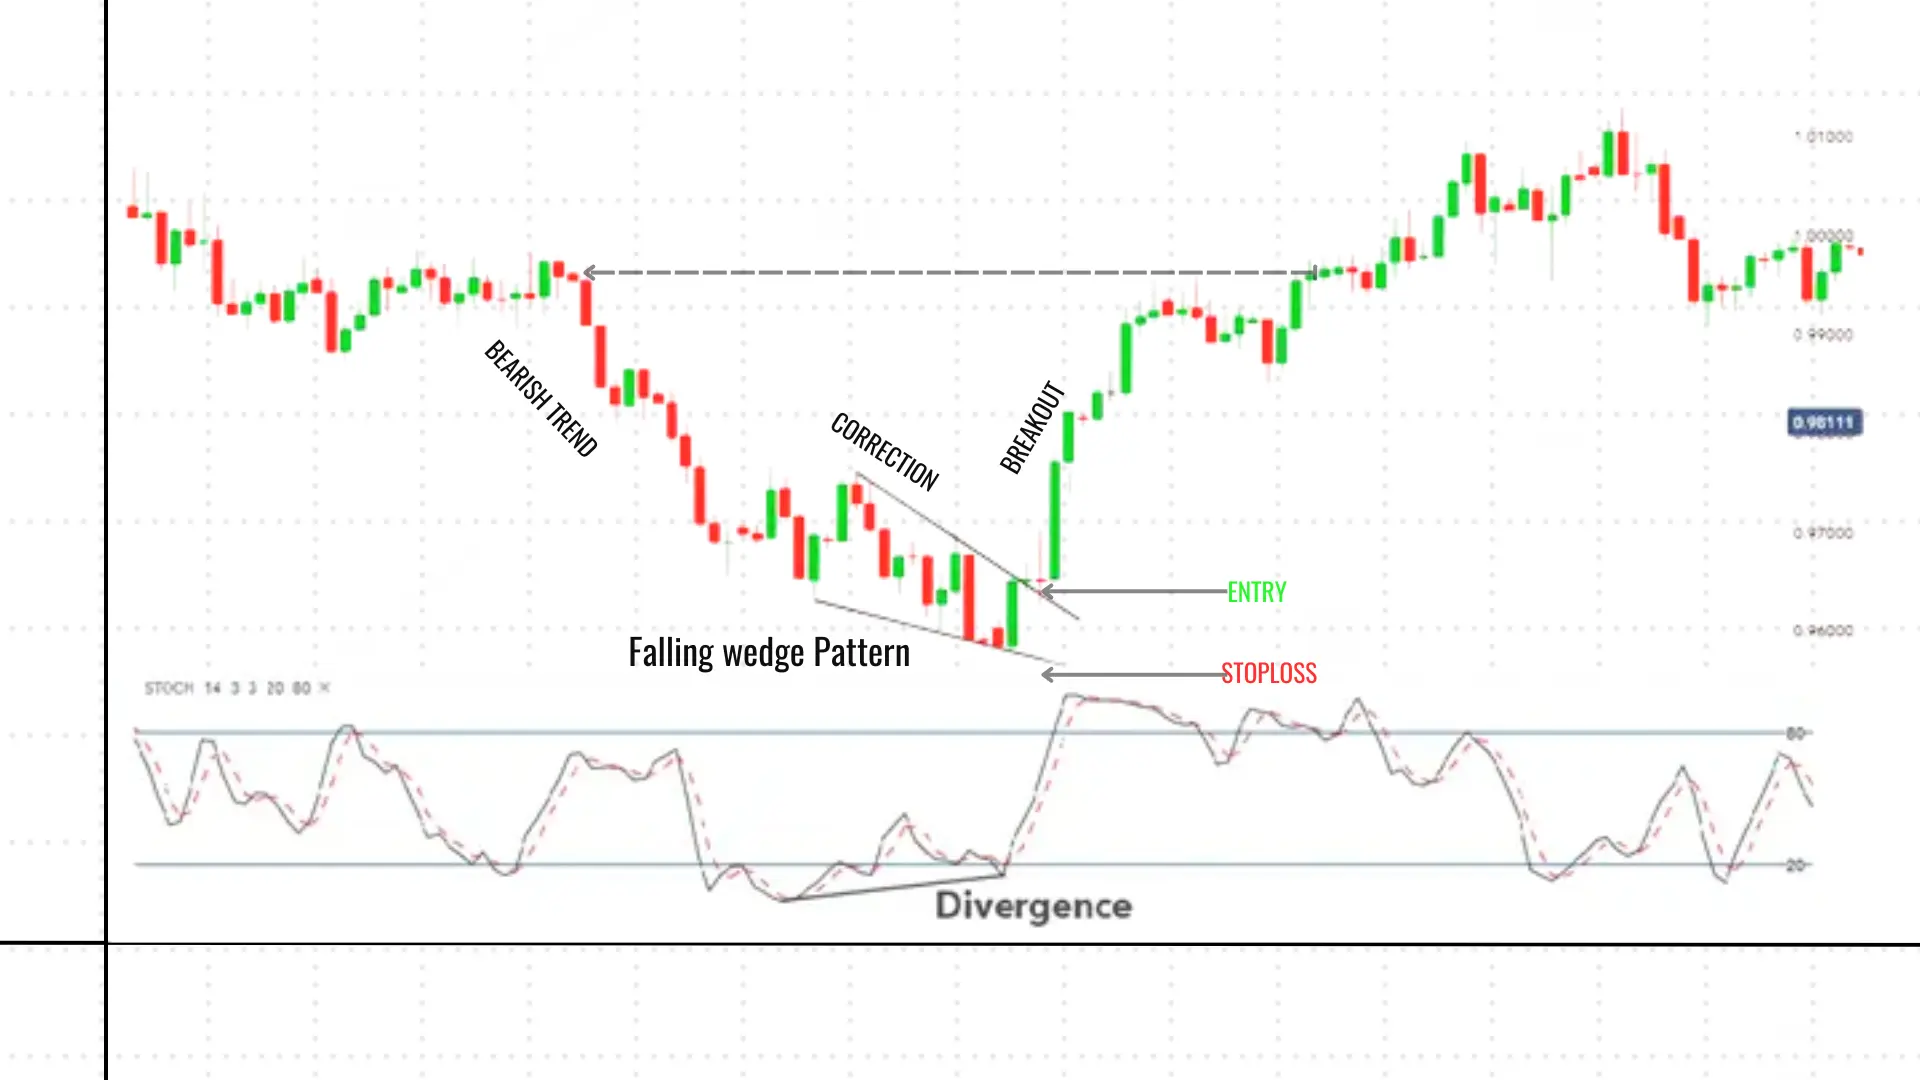
A falling wedge pattern is a chart formation that traders often spot in financial markets. It's like a triangle that's pointing downwards, with two converging trendlines. The upper line shows lower highs, while the lower line shows lower lows. This pattern usually signals that a downtrend might be coming to an end.
Characteristics of a falling wedge pattern:
Downward slope.
Converging trendlines.
Decreasing trading volume.
Falling wedges are considered bullish patterns, meaning they often lead to upward price movements.
How do you identify a Falling Wedge pattern?
Look for a clear downtrend market.
Draw trend lines connecting the highs and lows.
Check if the lines are converging.
Confirm decreasing volume.
How do you work with the Falling Wedge pattern?
What should be Entry Points?
The best time to enter a trade is usually when the price breaks above the upper trendline. This often signals the start of an uptrend.
What should be Stop Loss?
It's always smart to protect yourself. Place a stop loss just below the lower trendline or the most recent swing low.
Taking Profits
There's no one-size-fits-all approach here. Some traders aim for a price target equal to the height of the wedge. Others prefer to ride the trend and use trailing stops.

Common Mistakes to Avoid
Jumping in too early before the breakout, wait for confirmation.
Ignoring the overall market trend.
Not considering other technical indicators like volume and RSI.
I once lost money by entering a trade too early. The pattern looked perfect, but I didn't wait for the breakout confirmation. Lesson learned!
"Unlock Your Investment Potential – Open a Demat Account with Upstox Referral Link Today!"
