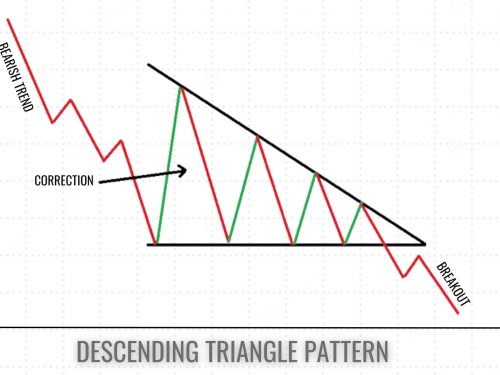
A descending triangle is like a shape that forms on price charts. Imagine drawing a flat line along the bottom where prices keep bouncing off from the support level, and a sloping line on top (resistance level) where prices keep getting lower. That's your descending triangle pattern.
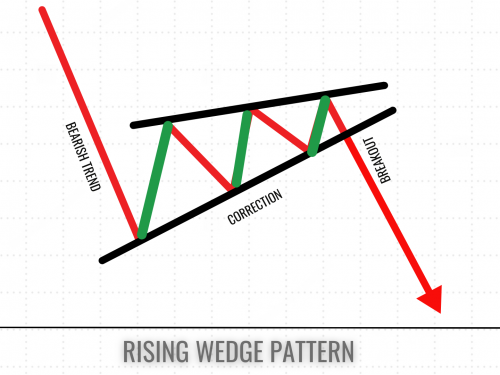
A rising wedge pattern is a chart formation that traders often spot in financial markets. It's like a triangle that's tilting upwards, with two converging trendlines. The upper line represents resistance, while the lower line shows support. As time goes on, these lines get closer together, creating a wedge shape.
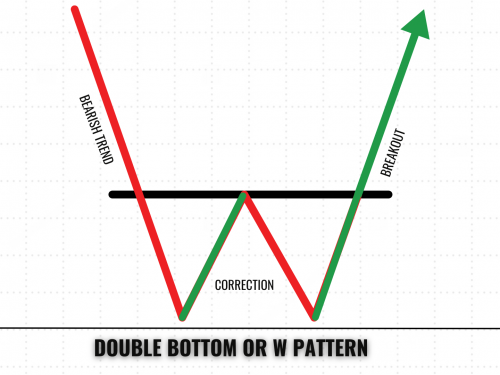
The double bottom or W pattern is a bullish reversal chart pattern, which looks somewhat like the English letter W. The double bottom pattern is most commonly used in intraday trading and swing trading. The accuracy of the W pattern is almost 70-75%.
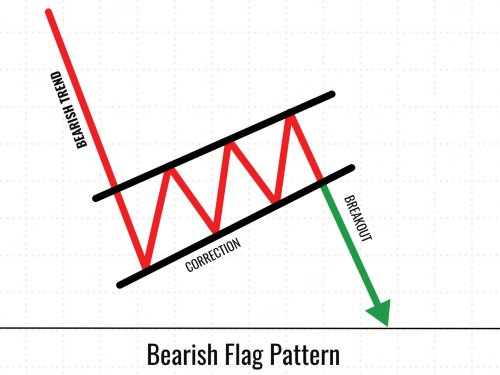
A bearish flag pattern is a chart pattern formed during a counter-trend down after a sharp fall in price movement. A bearish flag pattern forms during a downtrend. It got its name because it resembles a flag on a flagpole while the price continues to move in a downtrend, attaining lower lows and lower highs.
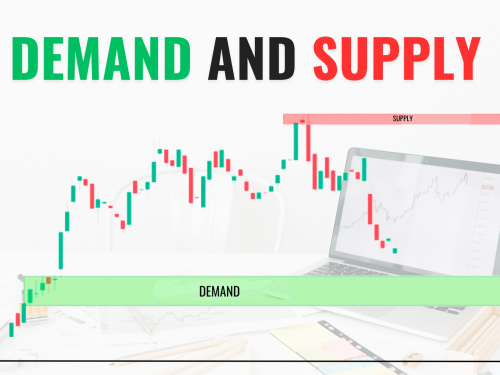
A resistance or supply zone is like an invisible ceiling in the stock market. It's a price level where a stock or index struggles to move higher due to which stock is unable to move upside from the level or when it reaches the resistance or supply zone, an investor selling their stock in the top-level called resistance or supply zone.
