What is the Volume Indicator in the Share Market?
What is a Volume Indicator?
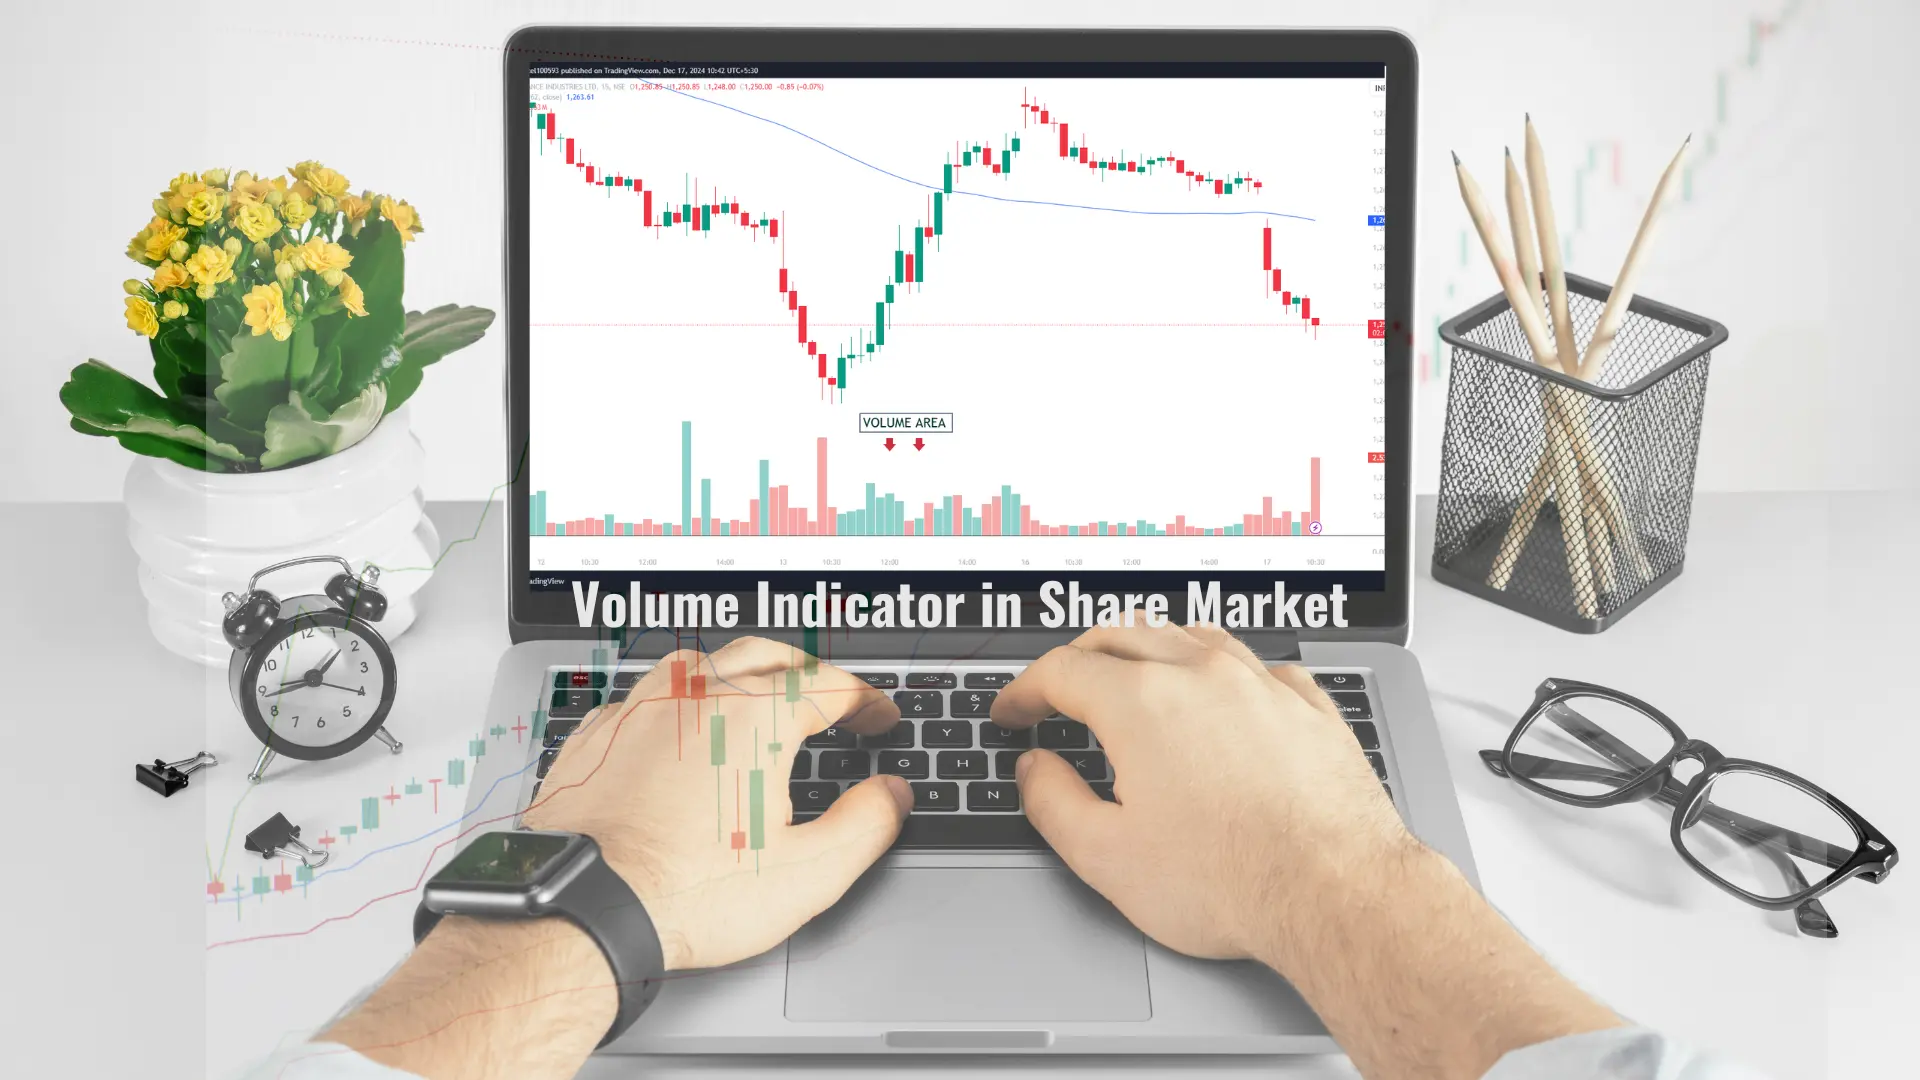
A volume indicator is a Technical analysis tool that measures the number of shares traded over a period of time it may be positive or negative. Think of it as a measure of how popular or active a stock is at any given moment. Volume indicators can be displayed as a line or histogram chart. They can be used to compare the current volume to the average or previous volume.
Why is the Volume indicator Important?
Volume is a super important indicator because it can tell us a lot about the strength of a price movement.
It helps confirm trends: When prices are going up with high volume, it's a good sign that the upward trend is strong.
It signals potential reversals: If prices are rising but volume is decreasing, it might mean the trend is running out of steam.
It shows market interest: High volume often means more people are interested in buying or selling a stock.
Types of Volume Indicators
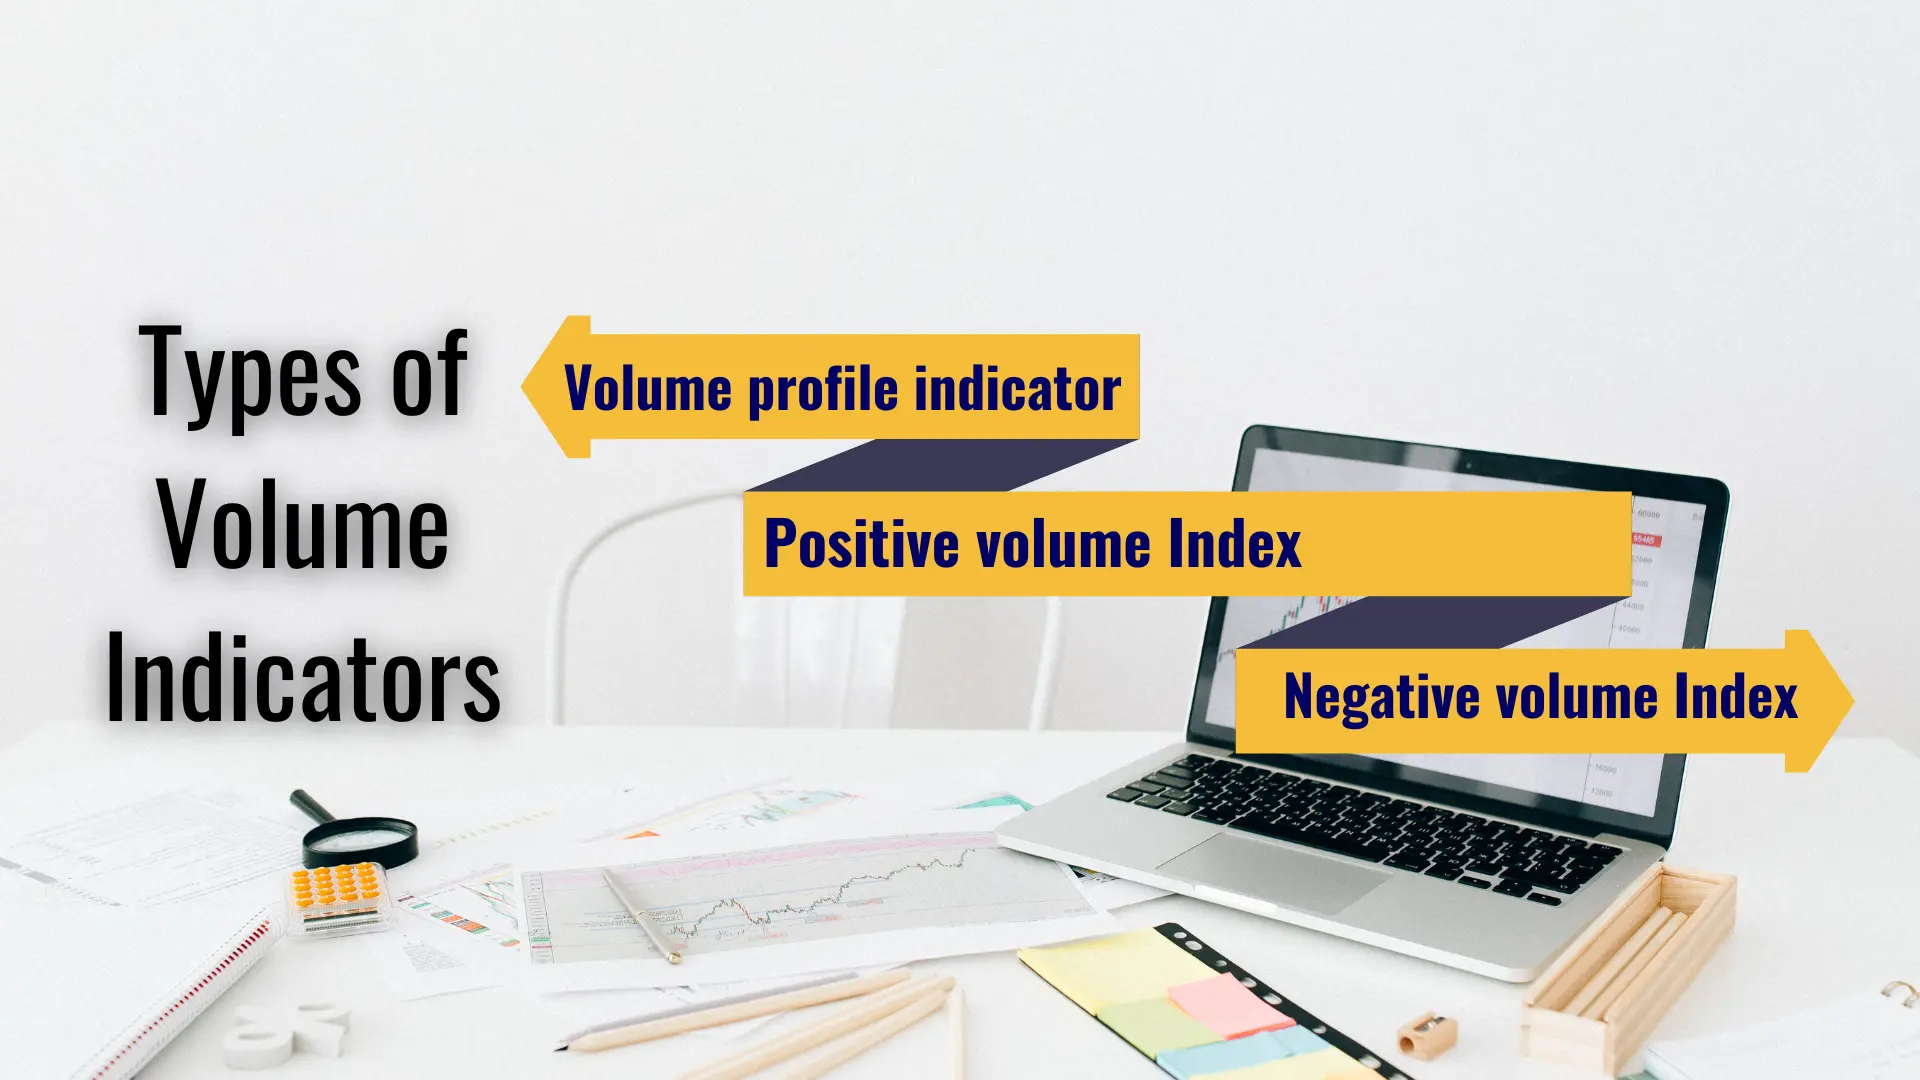
There are a few different types of volume indicators you might come across. Let's take a look at some common ones:
1. Volume profile indicator:
Volume profile indicator is a technical analysis tool that shows how volume trading is distributed across different levels over the price level over a specific period, also known as volume by price.
2. Positive volume Index:
The positive volume index is an indicator used in technical analysis that provides signals for price changes based on positive increases in trading volume.
3. Negative volume Index:
The negative volume index integrates volume and price to graphically show how price movements are affected by down volume days.
How to use Volume Indicators?
Look for confirmation: If a stock price is going up and the volume is increasing too, that's usually a good sign.
Spot divergences: If the price is going up but volume is decreasing, be cautious - the trend might be weakening.
Compare to average: Check how the current volume compares to the average. Higher than average volume often signals important price moves.
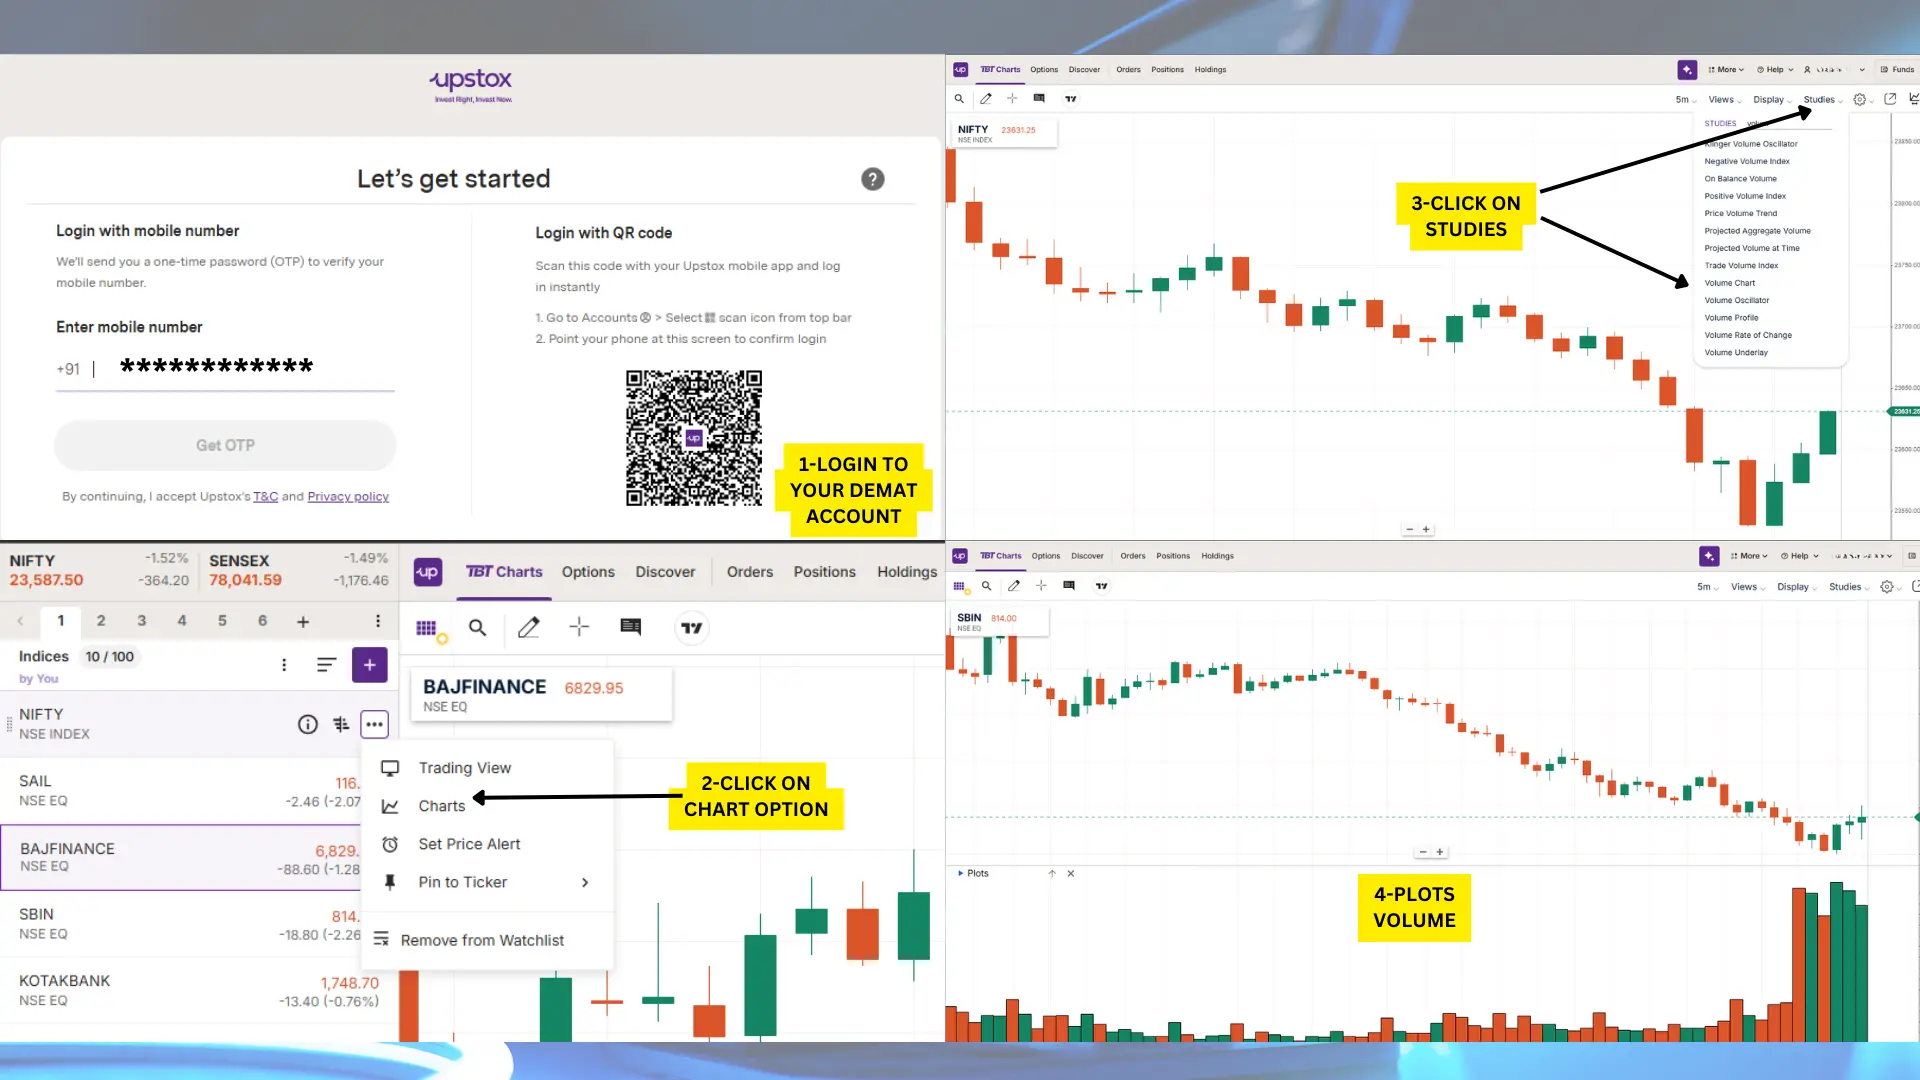
Login to your demat account and go to your chart, simply click on the indicator and search volume profile, and it will automatically be applied to the trading chart. For the same volume indicatorFor Example, I have logged in Upstox demat account, if you don’t have a demat account, you can open here demat account in Upstox. Click here

Common Mistakes to Avoid
Don't rely on volume alone: Always look at it alongside price action.
Be aware of scale: Sometimes volume spikes can be due to things like stock splits or big news events.
Remember, context matters: What's considered high volume for one stock might be low for another.
"Unlock Your Investment Potential – Open a Demat Account with Upstox Referral Link Today!"
