What Is Technical Analysis in the Share Market?
What is Technical Analysis?
Technical analysis is like being a detective in the stock market. Instead of looking at a company's financial health or the latest news, technical analysts focus on patterns in stock prices and trading volumes. They believe that history tends to repeat itself in the markets, and by studying past trends, they can make educated guesses about future price movements as per previous market history.
The important factor of Technical Analysis:-
Charts : The chart is the basis of the stock market, which shows the price movement of the stock market over the time period. The chart is an important tool for the stock market where the investor and trader analyze the market trend and behavior.
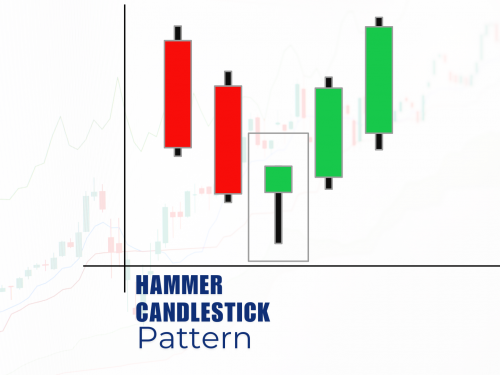
Patterns : Analysts look for specific patterns in price charts, like "head and shoulders" "double bottoms" or "bullish or bearish flag pattern.”
Indicators : These are mathematical calculations based on price and volume that help identify trends or potential reversals.
How to work Technical Analysis?
Studying Price Movements : Analysts look at how prices have changed over time.
Identifying Trends : They try to spot whether a stock is generally moving up, down, or sideways trends.
Recognizing Patterns : Certain price patterns might suggest that a trend is about to change.
Using Indicators : Tools like moving averages or relative strength index (RSI) provide additional insights.

Popular Technical Analysis Tools
Moving Averages:
Moving average and exponential moving average is a technical indicator that shows the average price of stocks over a set period of time on charts.
Relative Strength Index (RSI):
This indicator helps determine, if a stock might be overbought or oversold. Think of it as a speedometer for stock prices – it shows when they might be moving too fast in either direction.
Support and Resistance Levels:
These are price levels where a stock tends to stop falling or rising. It's like an invisible floor (support) or ceiling (resistance) for the stock price.
What are the benefits of Technical Analysis?
It can help you time your entries and exits in the market.
You don't need to be a financial expert to use it.
It works across different markets – stocks, forex, commodities.
Limitations of Technical Analysis
Always remember that no indicator has 100% Sureshot for stocks, you can analyze up to 60-80% only with the help of an indicator.
- It doesn't consider fundamental factors that might affect a company.
- Different analysts might interpret the same chart differently.
- Past performance doesn't guarantee future results.
How to start analysis with Technical Analysis?
Learn the basics: Start with simple concepts like trend lines and moving averages on charts.
Practice with charts: Look at historical data and try to spot patterns.
Use tools: Many websites and apps offer free charting tools.
Stay informed: Keep up with market news to complement your technical analysis.
"Unlock Your Investment Potential – Open a Demat Account with Upstox Referral Link Today!"


