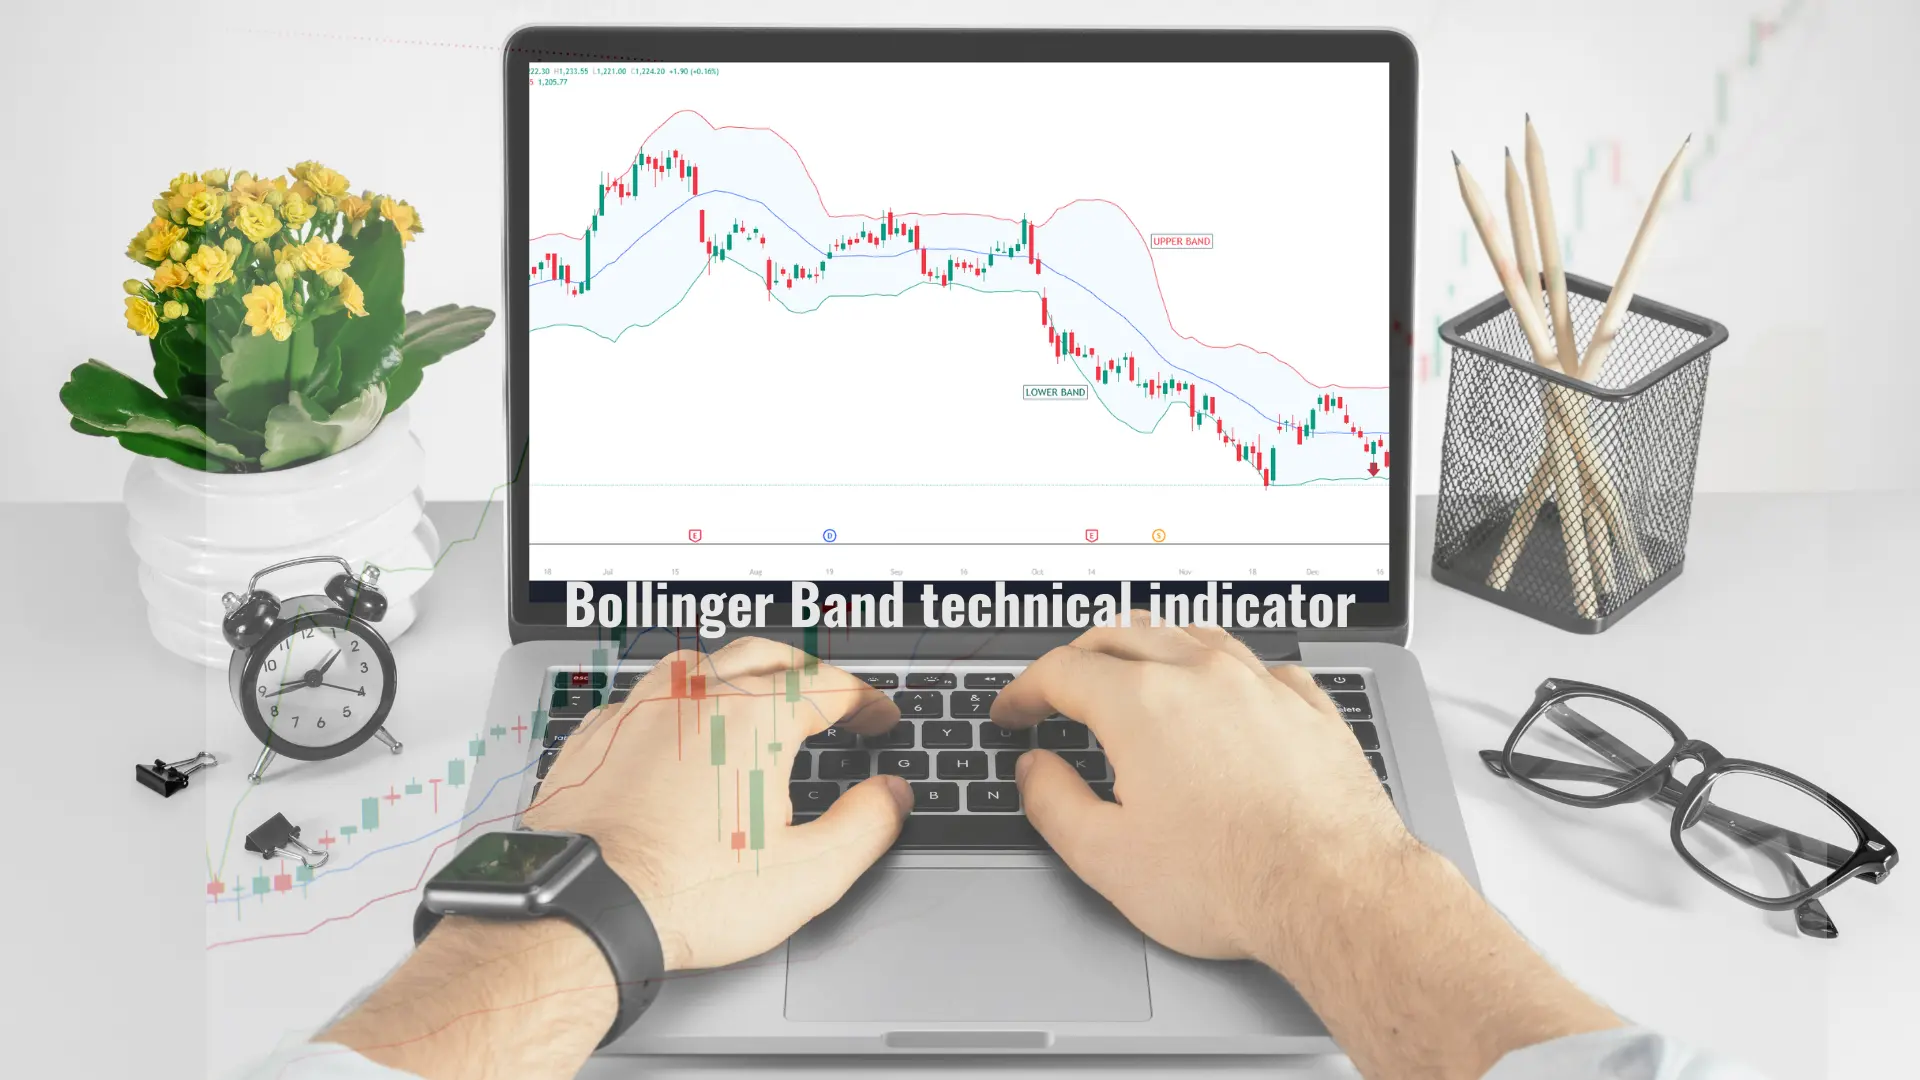
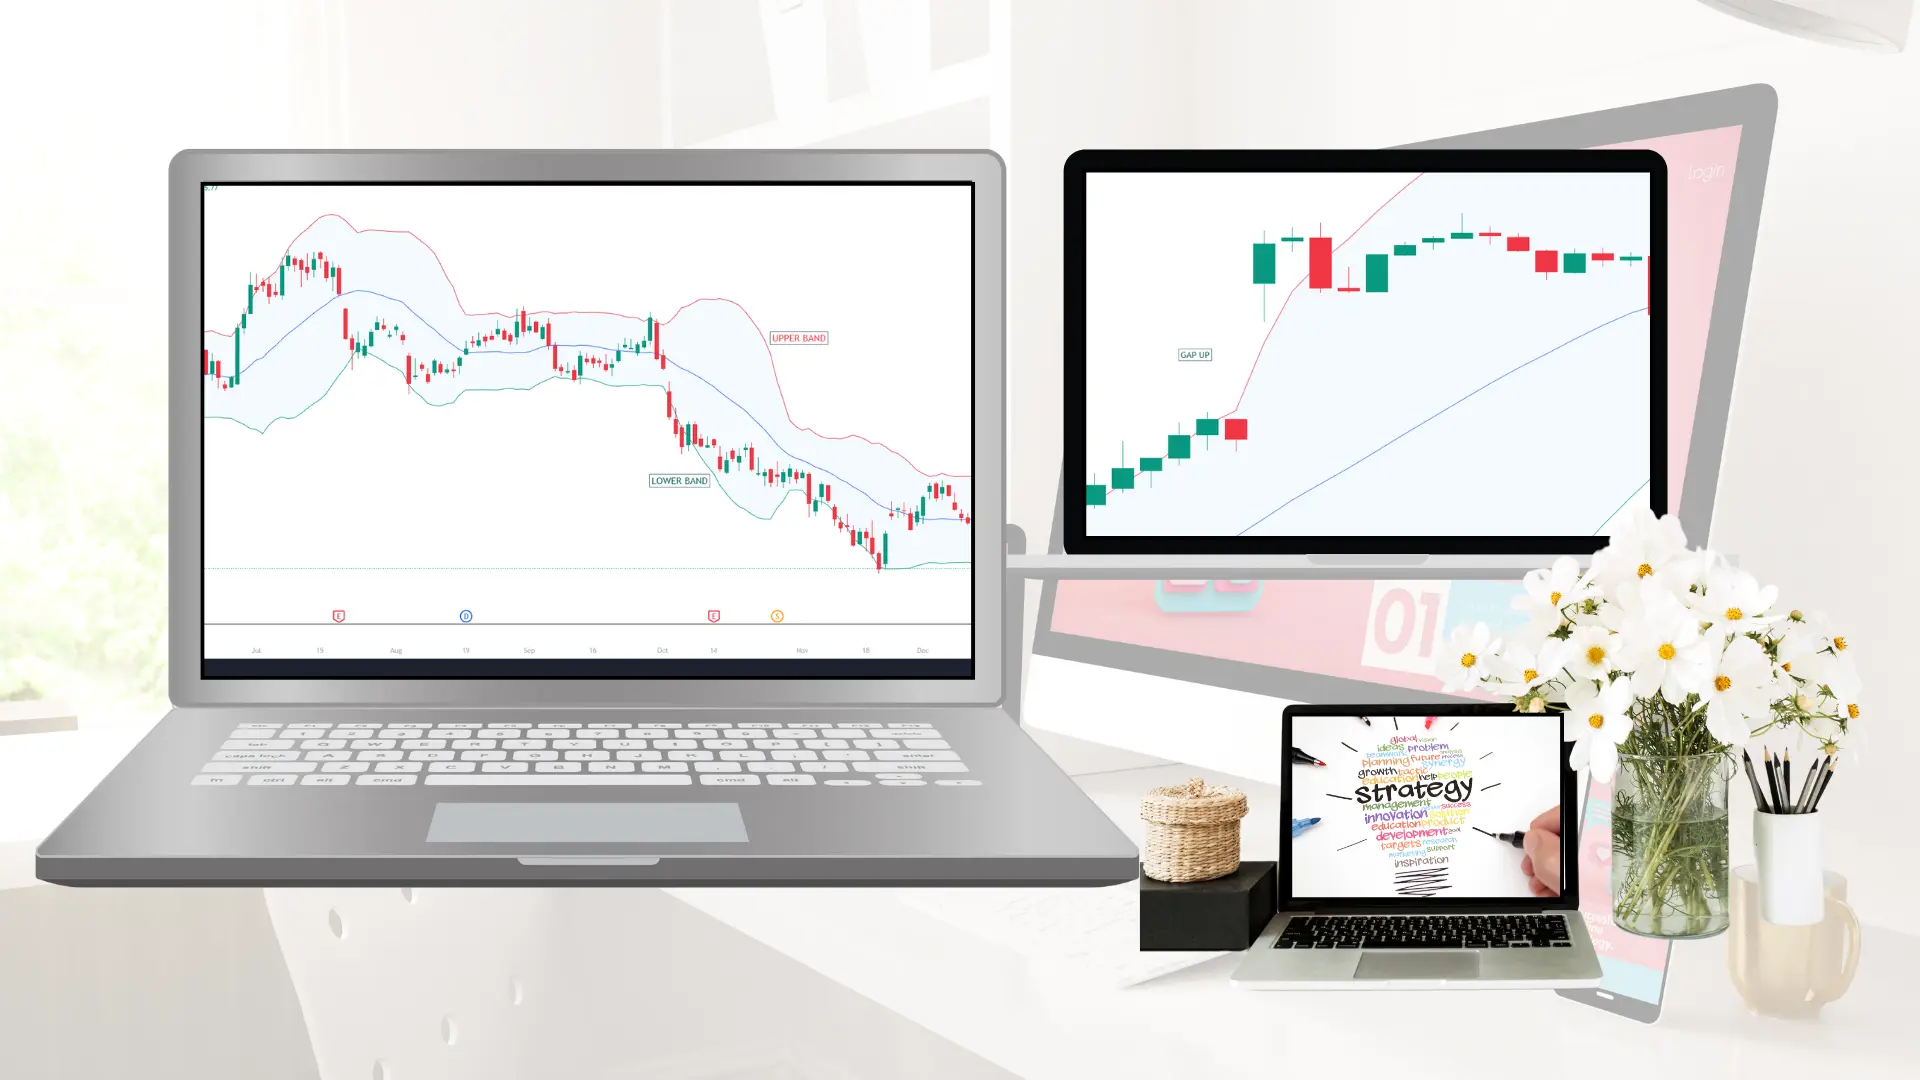
Bollinger Band technical indicator
This means long positions are trapped on top and the price falls or short positions are trapped on the bottom and the price goes up.
Bull trapping is highly reliable and successful because the bulls have already bought and held the positions, which, when exited, results in a huge price fall due to panic. But when bears are trapped at the bottom, people fear entering fresh longs. So, demand is lower than supply at the top. Hence, bull trapping is more successful.
Intraday strategy
Time frame = 15 min. candlestick chart
The 2nd candle means the next candle after the candle which formed outside the upper Bollinger band.
The 3rd candle means the next candle after the 2nd candle.
Bollinger band traps can be formed later in the day but the morning Bollinger band trap is most effective.
Strategy Setup: -
Filter out stocks that have opened the gap up from the previous day’s close.
Then look for 15 min. The candle formed outside the upper Bollinger band. Means open, high, close, and low – all outside upper BB.
The candle color can be either red or green.
Wait for the next candle to close below VWAP and the previous candle low, which is not possible in each stock and we can miss out on 75% of stocks, so follow step no.5.
Wait for the next candle to close below VWAP – high chance that this will be a red candle which results in higher accuracy. If the candle is green then it shall show rejection from the top forming a long upper wick and also, the price close below VWAP in 15 15-minute time frame
- It is best if the 2nd or 3rd candle closes below VWAP after forming candles outside the Bollinger band. Because the more time it takes, the less will be the reliability and effectiveness. You will get many stocks so don’t be in a hurry and FOMO.
What should be the Entry?
Now entry can be taken in 2 parts:
As soon as the candle closes below VWAP , take 50 % qty. Because sometimes prices don’t go back to touch VWAP . So, our trade is not missed in such cases.
Wait for the price to come back to touch VWAP and enter another 50% short position at or near VWAP .
Wait for the price to come back to VWAP take a 100% position and avoid those stocks in which the price doesn’t come back to VWAP . Don’t regret not taking positions afterward. There will be many stocks, and you can’t trade them all.

What should be Stop Loss?
There are 2 types of stop loss, let’s see both:
Exit the positions if two green candles close above the VWAP of 15 min. Each. Also, S.L. will be small, because it’s big players’ money. So, don’t be scared. Wait for the close of 2 candles. Sometimes price may form a long upper wick and again close near VWAP .
Wait for 1 candle close above the day high. This is your system stop-loss which you have to place in your terminal when you take the entry.
This fails 5% of the time only, according to backtest results.
Don’t be afraid as the price may be volatile just wait for 15 min. The candle is close to taking a stop loss.
Sometimes price may close below VWAP and give us entry, but then starts to consolidate and make small spinning tops Doji candles and remains range-bound. You may exit these stocks, because in such cases the price may reverse and blast. Or you can reduce your stop loss and place it just above Doji or VWAP …… (based on observation). Also, check if the price closed (crossed above) VWAP or 20 sma in a 1hr chart. This will give hints to exit as a higher time frame in buying.
What should be Target?
The target will be 20 sma on a 15-minute chart. It may come very fast or slow and steady after 12 pm. So, don’t panic and wait. As 20 sma is a dynamic average, as time passes the target will be reduced.
Also, keep a limit order near the day low or at 1% of the stock price. Because sometimes the price falls too fast and again comes back to VWAP. So, it helps to book 50% profits and if the S.L. is triggered afterward, then we will still be in profit.
Move your target up every 15 min. Based on 20 sma.
If the price closed below 20 sma then, more fall can be seen in price, to previous support or lower Bollinger band.
Just keep in mind to keep trailing your stop loss after at least a 1% move happened in your direction after entry was taken.

Common Mistakes to Avoid
Thinking the bands are absolute support and resistance levels.
Ignoring other indicators and relying solely on Bollinger Bands.
Forgetting about fundamentals and focusing only on technicals.
Tips for Success with Bollinger Bands
Always combine Bollinger Bands with other indicators for confirmation.
Practice on a demo account before using real money.
Keep learning and adjusting your strategy as you gain experience.
"Unlock Your Investment Potential – Open a Demat Account with Upstox Referral Link Today!"
